Overview of IBM Streams Concepts
Edit meThis tutorial is intended to help you get up and running with IBM Streams quickly. It will introduce the basic concepts and building blocks of a Streams application. You can follow along with Streams Studio or Microsoft Visual Studio Code to create the application.
Overview
Streams is an advanced analytics platform that allows you to develop applications that analyze data in real-time. You can ingest, analyze and correlate information as it arrives from thousands of real-time sources.
Although you can create Streams application with Java and Python, this tutorial focuseson Streams Processing Language (SPL).
This tutorial will cover the basics of creating a Streams application with SPL by creating an application that processes a stream of stock prices.
Basic Building Blocks
To write a Streams application, you need to first understand the basic building blocks: operators, streams, and tuples, and how they work together.
Tuples, Streams, and Operators
-
Streams: A stream is a continuous sequence of records. For example, think of images being uploaded to Twitter. Images are constantly being uploaded and the sequence of new images never ends. This sequence is an example of a Stream.
-
Tuples: A tuple represents a single record in the streaming data. It is a structured list of attributes and their data types. Continuing the example above, in the stream of images, each tuple could contain information about the image’s dimensions, tags, and so on.
-
Operators: An operator processes tuples in a stream, one by one. After the operator processes the records in memory, it produces a new stream of records as output. This new stream is then sent to another operator downstream. for further processing. An example operator could be one that checks each uploaded image to filter out inappropriate content.
As shown in the animation above, each node in the graph is an operator, and the connection between each node is a stream. Streams carry tuples, which in turn, contain the data to be processed. This is a simplification, as the graphs can grow very complex:
Build applications by connecting operators
To create a Streams application, you connect multiple operators in order of processing. This chain of operators makes up the application and is called the Streams graph.
Each graph starts with a source adapter, which produces the data to be analyzed, and the results are sent to a sink adapter (database, messaging system, etc) for storage or further processing outside Streams.
Each stream has a schema which describes the kind of data in each tuple.
How do I create a Stream?
Use an operator to create a Stream. The first Stream you create is the Stream containing the data you want to analyze from your external data source (Apache Kafka, JMS, MQTT, a database, HTTP endpoint and more).
To ingest this data, you use a special operator called a Source Adapter to connect to the external data source. The source adapter produces a stream of tuples that represent each event or message in the external data source.
How do I create an Operator?
You can use one of the hundreds of built-in operators in your application, or you can write your own.
Streams includes adapters for common scenarios and source adapters for popular systems, like Kafka and IBM Db2.
For example, you could create a Streams application that reads from Kafka with the KafkaSource operator, scores an R model with the RScript operator and saves the data to Db2 Event Store with the EventStoreSink operator. These are all built-in operators.
Finding available operators
The available operators are grouped into toolkits. See the documentation for a list of available and toolkits.
There are also open-source toolkits in the Streams GitHub project.
Writing your own operator
If you find that you need to write your own operator, you can also do so using Java, SPL, C++, or Python. You can wrap existing Java, C++ or Python code as a Streams operator.
But it is a good idea to first try creating a Streams application.
Create your first Streams application in SPL
Now, it’s time to write an application that covers the basic concepts.
The application will:
- Process stock trades from a CSV file.
- Filter out some of the stocks based on ticker names.
- For each stock, calculate the latest average, maximum and minimum ask price.
- Verify the calculation
- Print the results to
stdout. - Save the results to a file.
Here is the application’s graph: Each operator in the graph corresponds to one of the steps above.
If you haven’t already, see the previous section to run a completed version of this application.
You may find this example in the samples repository from GitHub: TradesApp Sample on GitHub, or download the zip file.
Input data overview
To start writing a Streams application, you must have an understanding of the data that you are trying to process. In our case our sample data is in a CSV file, to keep this tutorial simple. Each line in the CSV file has the following attributes:
- Ticker - a string that represents the name of the stock ticker
- Date - a string that represents the date of the stock quote
- Time - a string that represents the time of the stock quote
- Ask Price - the ask price of the stock at the specified time
Here is a sample of the CSV data that we are going to process:
#ticker, date, time, askprice
"GLD","27-DEC-2019","14:06:09.854",50.7
"IYF","27-DEC-2019","14:12:38.019",103.69
"IOO","27-DEC-2019","14:13:20.873",64.02
"AU","27-DEC-2019","14:13:32.877",49
"CAJ","27-DEC-2019","14:14:17.938",60
"EWZ","27-DEC-2019","14:14:46.039",33.25
1. Create the main composite
The entry point of a Streams application is a main composite. A main composite is like the main method from a Java / C++ program.
A main composite called MyTradesApp would be represented in SPL as follows:
// Main composite: MyTradesApp
// A main composite has no input port and no output port.
composite MyTradesApp
{
    //application graph goes here
}
1b. Add the graph clause
To write a directed flow graph in the main composite, we add a graph clause into the main composite. A graph clause is a section in the composite that describes a list of operators in the graph, how the operators are connected, and what data is sent between the operators.
/ Main composite MyTradesApp
// A main composite has no input port and no output port.
composite MyTradesApp
{
    graph
    //define application  here
}
2. Use operators to process data in steps
Remember, Streams applications are made up of operators. Each operator performs a specific task with an input stream of data and then produces an output stream that is the result of the processing.
What does an operator look like?
Defining an operator is not the same as using an operator. Using a built-in operator or one that you’ve created, is called invoking the operator.
Comparing to Java/C++, think of a class that is defined in a 3rd-party library. To use the class, you typically have to create an instance of it.
Similarly, an operator definition is like a class definition, whereas an instance of a class is similar to an operator invocation.
Operator definition, that is, creating operators, is a slightly more advanced topic which we will not cover here.
Let’s look at an example operator invocation, that is, an example of using an operator.
Sample operator invocation
The following snippet is a generic overview of an operator invocation, with the name of the operator that will be invoked, and its input and output, if any.
Every operator invocation is composed of the following:
- Output stream declaration: What output the operator produces, if any?,
- the name of the operator being invoked,
- the input stream, if any.
- Operator configuration is defined within curly brackets.
Here is a sample:
 stream<rstring name, int32 id> Operator2_output
                            = SomeOperator ( Operator1_output)
 {
    param
        myParameter: "some value";
 }
-
Output stream: The stream
Operator2_outputis the output stream. -
Output stream schema: A schema describes the data types and attributes in a tuple. This stream is defined with a schema of
<rstring name, int32 id>. This means that each tuple on the stream will have 2 attributes:nameandid. -
Operator name: The
SomeOperatoroperator is being invoked. -
Input stream that the operator will process is always the output stream of another operator. In the example above,
SomeOperatorconsumes data from a stream namedOperator1_output.
Finally, this operator is configured with some parameters, which are specified with the param clause.
There are additional options for customizing an operator, which we will cover later.
Now that we know the generic format of using operators, let’s start adding operators to the application graph.
2.1 Ingest the input data from a file
You always start with ingesting the data that you want to analyze. This is usually data ingested from a live source such as Kafka. In our case our sample data is in a file, to keep this tutorial simple.
In this case, the first operator we’ll use is a FileSource operator to read the input file. The FileSource is an operator from the spl.adapter namespace in the SPL Standard Toolkit.
/** Main composite for stock processing application
 *
 */
composite MyTradesApp
{
    graph
         stream<rstring ticker, rstring date, rstring time, float64 askprice> Quotes= FileSource()
         {
            param
             file: getApplicationDir() + "/data/trades.csv";
             format: csv;
         }
}
In this operator invocation, we have defined the following:
- Operator kind:
FileSource. - Output stream name:
Quotes. - The output stream schema, containing 4 attributes:
ticker, date, time and askprice. This schema must match the format as specified in the CSV file for the operator to be able to parse the contents of the file.
Within the operator invocation (curly brackets), we use the param clause to specify the location of the file using the file parameter.
To parse the input file as comma-separated-values, assign csv as the value for the format parameter.
This is all it takes to read a CSV file for processing.
So far, the application graph has one operator and looks like this:
2.2 Filter the input data by ticker ID
Next, we are going to filter stocks by ticker with a Filter operator.
/** Main composite for stock processing application
  *
 */
composite MyTradesApp
{
    graph
        stream< rstring ticker, rstring date, rstring time, float64 askprice>Quotes = FileSource()
         {
             param
                 file: getApplicationDir() + "/data/trades.csv";

                 format: csv;
         }

         stream<rstring ticker, rstring date, rstring time, float64 askprice>FilteredQuotes = Filter(Quotes)
         {
             param
                filter: ticker != "GLD";
         }
}
- Operator Kind:
Filter. This operator consumes theQuotesstream from theFileSourceoperator. - The
Filteroperator produces an output stream namedFilteredQuotes. - A parameter named
filterspecifies the condition to allow a tuple to pass through the filter:- If the ticker name is not GLD, then the tuple will be included in the output stream,
FilteredQuotes. Otherwise, it will not be included in the output stream.
- If the ticker name is not GLD, then the tuple will be included in the output stream,
- For a
Filteroperator, the output stream schema is always the same as the input stream schema. If a tuple is allowed to pass through in theFilteroperator, attributes from the input stream will automatically be assigned to the same attributes on the output stream.
This is what the application graph looks like now:
2.3 Calculate average price with the Aggregate operator.
Use another built-in operator called Aggregate to calculate the minimum, maximum and average askprice of each stock.
 stream<rstring ticker, float64 min, float64 max, float64 average>AvgPrice = Aggregate(FilteredQuotes as inPort0Alias)
 {
     <window
          inPort0Alias : tumbling, count(5), partitioned ;
     param
          partitionBy : ticker ;
      output
          AvgPrice : min = Min(askprice),
          max = Max(askprice),
         average =Average(askprice) ;
 }
The Aggregate operator consumes data from the FilteredQuotes stream and produces a stream named AvgPrice.
There are a couple of new clauses in this operator invocation, window and output. What do they do?
Window clause
An operator usually processes each individual tuple as it arrives. But sometimes, that processing needs to include data from previous or future tuples. For example, to calculate the average price of the last 5 tuples, we need to have received 5 tuples before computing the average.
Using windows helps solve this problem.
What is a window?
A window is a way to divide the stream of tuples into subsets. Tuples are stored in order of arrival.
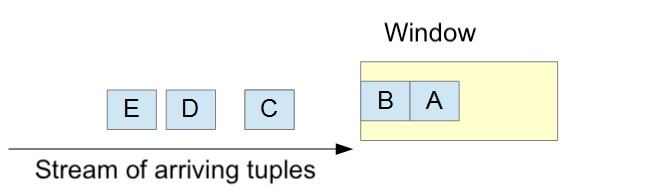
As shown above, a window stores tuples as they arrive.
When the window is “full”, that is when there are 5 tuples in the window, the operator will:
- Process the tuples in the window,
- Produce output, and
- Remove one or more of the tuples from the window.
**Configuring the window clause **
The window clause specifies what kind of window we will create, how many tuples to collect in the window before processing, and any further subdivisions on the window..
Let’s look at the different components:
inPort0Alias : tumbling, count(5), partitioned ;
-
inPort0Alias: This is the alias we gave to the input stream. So this is saying we want to configure a window on the input stream. This is helpful because sometimes an operator might have more than one input stream.
-
tumbling: This means we want a tumbling window. Using a tumbling window means that all the tuples in the window are processed and removed at the same time. This is effectively a form of batch processing. The other kind of window is a sliding window, which process all the tuples in the window but only remove the oldest. What constitutes “oldest” and other details are beyond the scope of this tutorial. See this article for details
-
count(5): The window size is specified here as a count-based window, with a count of 5. This simply means that whenever there are 5 tuples in the window, the operator will process all of them and empty the window. The tuples are said to tumble out, which is why it is called a tumbling window.
The last component is the partitioned flag.
Partitioning a window
Defining a window as partitioned will divide the tuples in the window into smaller windows based on an attribute. These sub-windows are called partitions.
Why do we need this?
Remember that we want to compute the min, max and average price for each stock ticker. Let’s say this list represents the first 5 tuples the operator receives:
    ticker, date, time, price
    "AU","27-DEC-2019","14:13:32.877",49
    "CAJ","27-DEC-2019","14:14:17.938",60
    "EWZ","27-DEC-2019","14:14:46.039",33.25
    "AU","27-DEC-2019","14:15:32.877",47
    "AWZ","27-DEC-2019","14:16:46.039",33.1
We have 5 tuples, but we only have 1 or 2 tuples for each stock ticker. So creating a simple window of 5 tuples will not work.
Thus, we partition the window by the ticker attribute. This will create sub-windows, or partitions, for each ticker. Thus each tuple with the same ticker will be in the same partition, and the min, max and average will be computed for each ticker when the partition has 5 tuples with the same ticker.
For example, when the first tuple in the list above arrives, the operator creates a window of 5 tuples for the “AU” stock. With the next tuple, a separate window is created for the last 5 stock prices for the “CAJ” stock, and so on. Each window is maintained simultaneously for each unique stock ticker.
The output clause
The output clause is used to define attributes that will be on each tuple in the output stream.
Recall the output clause we’re using:
output
         AvgPrice : min = Min(askprice),
                    max = Max(askprice),
                    average = Average(askprice) ;
This says that the AvgPrice stream is the output stream, and that it will have 3 attributes: min, max and average.
The min, max and average of the askprice will be computed using the output functions ( Min, Max and Average) and assigned to respective output attributes..
2.4 Print the Results with a Custom operator
Add a Custom operator to do some special processing with the data in the AvgPrice stream. The Custom operator is a special logic-related operator that can receive and send to any number of streams and does not do anything by itself. Thus, it offers a blank slate for customization in SPL.
stream<rstring ticker, float64 min, float64 max, float64 average>
 PrintAvPrice = Custom(AvgPrice)
{
     logic
         onTuple AvgPrice: {
             if (average == 0.0l)
             {
                  printStringLn("ERROR: " + ticker);
             }
             else
            {
                printStringLn("Average asking price for " + ticker + "  is " +(rstring)
							average) ;
               submit(AvgPrice, PrintAvPrice);
            }
        }
 }
To write custom SPL logic, we add a logic clause in the Custom operator. On each tuple received by the operator, the logic clause is executed. In our logic clause, we check the average ask price for the stock. We flag an error with the data if the average ask price is zero and will not submit the tuple to the output port. If the average ask prices is greater than zero, then we submit the tuple to the PrintAvPrice output stream.
This is a very simple example of some of the checking you could add with a Custom.
Our application graph has now been extended:
2.5: Writing results to a file
Note: If you are running the application in the cloud you might not have access to the file system, so you might not be able to see the results file.
If you wanted to write the output to a file, you could use a FileSink operator.
It consumes the output stream, PrintAvPrice, from the Custom operator and saves it to a file.
Notice that the FileSink does not define an output stream because it does not produce any output.
 () as PrintToFile = FileSink(PrintAvPrice)
     param
          file : "/tmp/tradesSummary.csv" ;
          flush : 1u ;
          format : csv ;
 }
FileSink parameters
The operator writes output to a file named /tmp/tradesSummary.csv.
The flush parameter controls how often the operator will flush content to the file system. In this case, the operator will flush after each tuple is received.
The format parameter tells the operator to write the data to the file as csv, comma-separated values.
That is it! We have created an application that computes the average, min and max price of the stock tickers and prints the result.
Complete application source
Here’s the source code for this application:
composite MyTradesApp
{
    graph
        stream<rstring ticker, rstring date, rstring time, float64 askprice>Quotes = FileSource()
         {
             param
                 file: getApplicationDir() + "/data/trades.csv";
                 format: csv;
         }

         stream<rstring ticker, rstring date, rstring time, float64 askprice>  FilteredQuotes = Filter(Quotes)
         {
             param
                 filter: ticker != "GLD";
         }

        stream<rstring ticker, float64 min, float64 max, float64 average>
        AvgPrice = Aggregate(FilteredQuotes as inPort0Alias)
        {
            window
                inPort0Alias : tumbling, count(5), partitioned ;
            param
                partitionBy : ticker ;
            output
                AvgPrice : average =Average(askprice),
                min = Min(askprice), max = Max(askprice) ;
        }

        stream<rstring ticker, float64 min, float64 max, float64 average>
         PrintAvPrice = Custom(AvgPrice)
        {
            logic
                onTuple AvgPrice: {
                    if (average == 0.0l)
                    {
                       printStringLn("ERROR: " + ticker);
                    }
                    else
                    {//
                        printStringLn("Average asking price for " + ticker + "  is " +(rstring)
							average) ;
                       //example showing how to copy input stream to output in a Custom
                       submit(AvgPrice, PrintAvPrice);
                    }
                }
         }

         () as PrintToFile = FileSink(PrintAvPrice)
         {
            param
               file : "/tmp/tradesSummary.csv" ;
               flush : 1u ;
               format : csv ;
         }
}
Running the application
Regardless of the IDE you are using, you have to follow these steps to create and compile a Streams application:
- Create a project,
- Create a namespace (optionally)
- Create a main composite in a
.splsource file in the project - Define the application graph like we did in this section
- Compile the main composite.
1. Create a project and a main composite
You can use the Streams extension for Microsoft Visual Studio Code (VS Code) or Streams Studio.
The general steps to create a new SPL project are:
- Create an empty folder on your filesystem and import the folder into your workspace.
- Create a toolkit information file.
After you create your project, you can create applications. The entry point of any SPL application is called a main composite.
Create your first main composite by doing the following tasks:
- Define a namespace to organize your code. This is not necessary but is good practice.
- Create a main composite within a
.splfile.
Create the project folder
- Create an empty folder on your file system, for example,
MyStreamsProject. - Go to File > Add Project Folder and select the project folder.
Create a toolkit information file
SPL projects are also called toolkits. Each toolkit folder must include a file called info.xml in the top level of the project. This file describes the toolkit and any other toolkits it depends on.
Important: This file must be in the top level of the project.
Create a file within the folder called info.xml.
Right-click your project folder, and select New File, and enter info.xml as the file name.
For your reference, the following code snippet is an overview of the contents of what needs to be present in the file. You can copy the contents into your info.xml file to get started.
identitytag contains general details about the project, name, version and required Streams version.dependenciestag lists any toolkits you require.sabFilestag indicates which folders within the project contain files that your application will access at runtime.
<info:toolkitInfoModel
  xmlns:common="http://www.ibm.com/xmlns/prod/streams/spl/common"
   xmlns:info="http://www.ibm.com/xmlns/prod/streams/spl/toolkitInfo">
  <info:identity>
    <info:name>MyStreamsToolkit</info:name>
    <info:description>My first toolkit</info:description>
    <info:version>1.0.0</info:version>
    <info:requiredProductVersion>4.0.0</info:requiredProductVersion>
  </info:identity>
  <info:dependencies>
    <info:toolkit>
      <common:name>com.ibm.streams.cep</common:name>
      <common:version>[2.1.1,3.0.0)</common:version>
    </info:toolkit>
  </info:dependencies>
  <info:sabFiles>
    <info:include path="data/**"/>
    <info:include path="etc/**"/>

  </info:sabFiles>
</info:toolkitInfoModel>
Learn more about the toolkit information file in the documentation.
Create a namespace
You can use namespaces to organize your SPL code, similar to Python modules or Java® packages. Any folder with an empty file called .namespace is treated as an SPL namespace.
Create a folder within your project with the target namespace with the following steps:
- Select the project, right click, and click New Folder.
- Enter a name for the namespace, e.g.
my.name.space: - Create a new empty file within the
my.name.spacefolder and call it.namespace. The final folder structure should look like this:- MyStreams project
my.name.space.namespace
info.xml
- MyStreams project
Now that your namespace is created, you can create your first SPL source file.
Create a main composite
Executable SPL applications are called main composites, and they are defined in SPL source files. These files have a .spl extension.
Create a source file within a namespace:
- Right-click the
my.name.spacefolder, right-click and choose New File. - Enter the name for the new SPL file,
Main.spl. - Add the namespace declaration to the file with the following line:
namespace my.name.space;
Create a main composite
The following code is a stub for a new main composite called MyComposite in the my.name.space namespace:
namespace my.name.space;

composite MyComposite {
}
The New SPL Application Project wizard takes care of a number of steps in one pass: it creates a project, a namespace, an SPL source file, and a main composite.
In Streams, a main composite is an application. Usually, each main composite lives in its own source file (of the same name), but this is not required. This section does not explore composite operators or what distinguishes a main composite from any other composite.
To create a project and a main composite:
- Click File > New > Project. Alternatively, right-click in the Project Explorer and select New > Project.
- In the New Project dialog, expand IBM Streams Studio, and select SPL Application Project.
- Click Next.
- In the New SPL Application Project wizard, enter the following
information:
- Project name:
MyProject - Namespace:
my.name.space - Main Composite Name:
MyMainComposite
- Project name:
- Click Next.
- On the SPL Project Configuration panel, change the Toolkit name
to
MyToolkit. - In the Dependencies field, clear Toolkit Locations.
- Click Finish. Project dependencies: In the Dependencies field you can signal that an application requires operators or other resources from one or more toolkits---a key aspect of the extensibility that makes Streams such a flexible and powerful platform. For now, you will use only building blocks from the built-in Standard Toolkit.
- Check your results.
You should see the following items in Streams Studio:
- The new project shows in the Project Explorer view on the left.
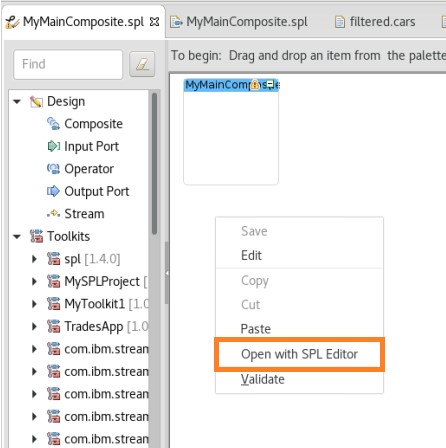
- The code module named MyMainComposite.spl opens in the graphical editor with an empty composite named MyMainComposite in the canvas.
This automatically opens the graphical editor, but in this tutorial we're going to be working directly with SPL code, so open the SPL Editor:
2. Save the application source
Copy and paste the full application source in the .spl file you created. Save the file.
3. Launch the application
Follow the steps for your IDE to launch the application.
This is a summary of the same steps you followed when you ran the sample application in the previous section.
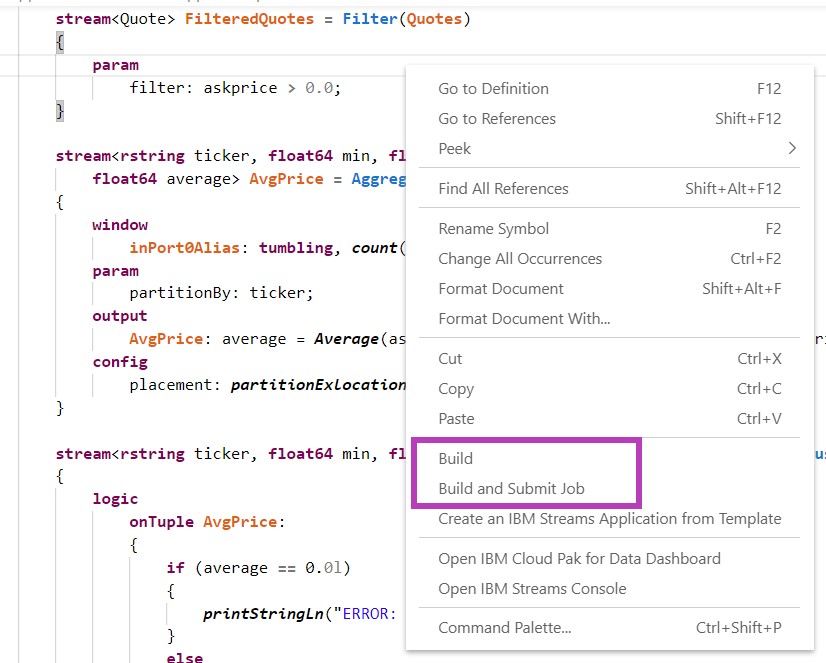
Right click from within the .spl source file and click Build and submit job.
The application should automatically be built if you are using Streams Studio, so you are ready to launch it.
If your application does not build automatically, right click the project in the Project Explorer and click Build Active Configurations. Then follow the instructions to launch the application from Streams Studio.
Sample Application Output
Download the job’s logs to view the output.
You can also review the output in the results file, /tmp/tradesSummary.csv.
You will find entries like this in the file. The first string is the ticker name of the stock that you have done this analysis for. The next 3 numbers are the minimum, maximum, and average ask price for the stock, respectively.
ticker, min, max, average
"WLV",5.13,5.18,5.158
"ABI",26.59,26.59,26.59
"AF",30.24,30.25,30.246
"CIB",28.88,28.99,28.962
"CIN",42.91,42.95,42.926
"COT",14.68,14.83,14.738
Review
So far, we created and ran an SPL application using some of the built-in operators: FileSource, Filter, Aggregate, Custom and FileSink.
Recall that an operator invocation starts by defining the output schema and name of the output stream, as well as the name of the operator being invoked and its input stream.
Operator invocation clause review
When configuring the operator invocation, we used the param, window, and output clauses.
The following is a full list of all the supported operator clauses.
 stream<rstring name>  Operator2_output = SomeOperator (Operator1_output)
 {
     logic
       onTuple Operator1_output :
      {
        printStringLn(Operator1_output.name) ;
      }

    window
       inputStream : tumbling, count(5) ;
    param
       param1 : "param1Val";
       param2 : "param2Val";
    output
       Operator2_output : name = name + " newName" ;
    config
       placement : partitionColocation("pe1") ;
 }
The following is a brief description of each clause. If used, the clauses must be specified in the order as shown.
-
logic: To add additional processing for every incoming tuple, use the logic clause. The logic clause is called each time the operator receives a tuple. You may write custom SPL code here to process the input tuple, for example, printing the tuple as shown above.
-
window: To process groups of tuples at a time instead of each individual tuples, use a window clause. A window is a way to divide tuples into groups for processing. For example, to compute the average price of the last 10uples, we need to create a window of size 10. When the window has 10 tuples, the average will be computed and submitted to the output stream, and the 10 tuples will be removed from the window since they have been processed.
-
params - Each of the operators define a set of parameters to help you customize its behaviour.The params clause allows you to specify the values of the parameters.
-
output -The output clause allows you to customize attribute assignments of the output tuple. By default, if the input stream and the output stream contains an attribute of the same name and same type, the attribute value of the input stream will be automatically assigned to the same attribute on the output stream. In addition, you may customize output attribute assignment by specifying custom assignment expressions in the output clause. If the output stream contains an attribute that is not present in the input stream, you must specify an assignment for that attribute in the output clause.
-
config - The config clause allows you to specify various operator / process configurations supported by Streams. For example, you may use the config clause to control if two operators should run in the same process. You may also use the config clause to control which resource / host to run the process on.
Streams Application Pattern
The sample Streams application demonstrates a common Streams application pattern. Most applications follow this pattern described as follows.
Data is ingested from various data sources. As data flows through the application, it is prepared, analyzed and processed in memory.
You can optionally store the data into a data store for record keeping or deeper analysis at any stage of the application.
With the exception of the Ingest stage, all stages in this application pattern are optional. 
-
Ingest: At the beginning of all Streams applications is the Ingest stage. In this stage, the application consumes continuous live data from disparate data sources. A data source can be a machine sensor, live feeds from social media sites, databases, file system, HDFS, etc. Streams provides a set of adapters to help ingest data from different kinds of data sources. Streams can handle structured and unstructured data, including XML, JSON, voice, videos, signals, etc.
-
Prepare: In this stage, the application can parse, transform, filter, clean, aggregate, or enrich the data in memory, preparing the data for real-time analytics. For example, if your application is ingesting JSON data, you might need to convert the JSON to Streams tuples. Or, if it is analyzing videos from security cameras, you may need to process and parse the videos. At this stage, you may also correlate data from the different data sources, and enrich the data for analysis.
-
Detect and Predict: This is the stage where the application performs real-time analysis of the data, and for the application to gain insight into the data that is coming through. Streams provides a set of toolkits for data analysis. For example, Streams provides a timeseries toolkit for modeling, anomaly detection, and short-term and long-term forecasting. The R toolkit allows you to analyze your data using R with your existing R scripts. There are many more toolkits available, and if you need specialized analysis, you may write your own toolkits and operators to analyze the data.
-
Decide: In this stage, you use the insight gathered in the previous stage, and create logic to decide how to act on that insight. In addition, Streams can integrate with Business Rules software, like Operational Decision Manager (ODM). You may run the business rules against the flowing data, allowing you to make critical business decisions in real-time.
-
Act: In this stage, we act on the decision made from the previous stage. You may send the analysis result to a data visualization server. You may decide to send an alert to someone about the anomaly detected in the data. You may publish the results to a list of subscribers.
Monitoring and managing your applications
Streams applications can be monitored using the Job Graph or the Streams Console. The tool you'll use depends on your development environment and/or preference. The Job Graph is only available in Cloud Pak for Data, but the Streams Console is included with all versions of Streams.
Using the Job Graph
The Job Graph is available in the CPD web interface
For the Job Graph in CPD, see this section.
Using the Streams Console
If you are not using Streams in CPD or are looking for a more advanced alternative to the Job Graph, you can monitor the health of your Streams application and cluster using the Streams Console.
The Job Graph is also available in the Streams extension for VS Code.
Next steps
-
Review the tips for creating SPL applications.
-
Follow a hands-on tutorial for creating SPL applications:
-
With VS Code: See the SPL application guide.
-
With Streams Studio: Follow the Streams Studio Hands-on tutorial.
-
Reference information
- Operator references
- Streams on GitHub