Monitoring IBM Streams applications with Streams Console
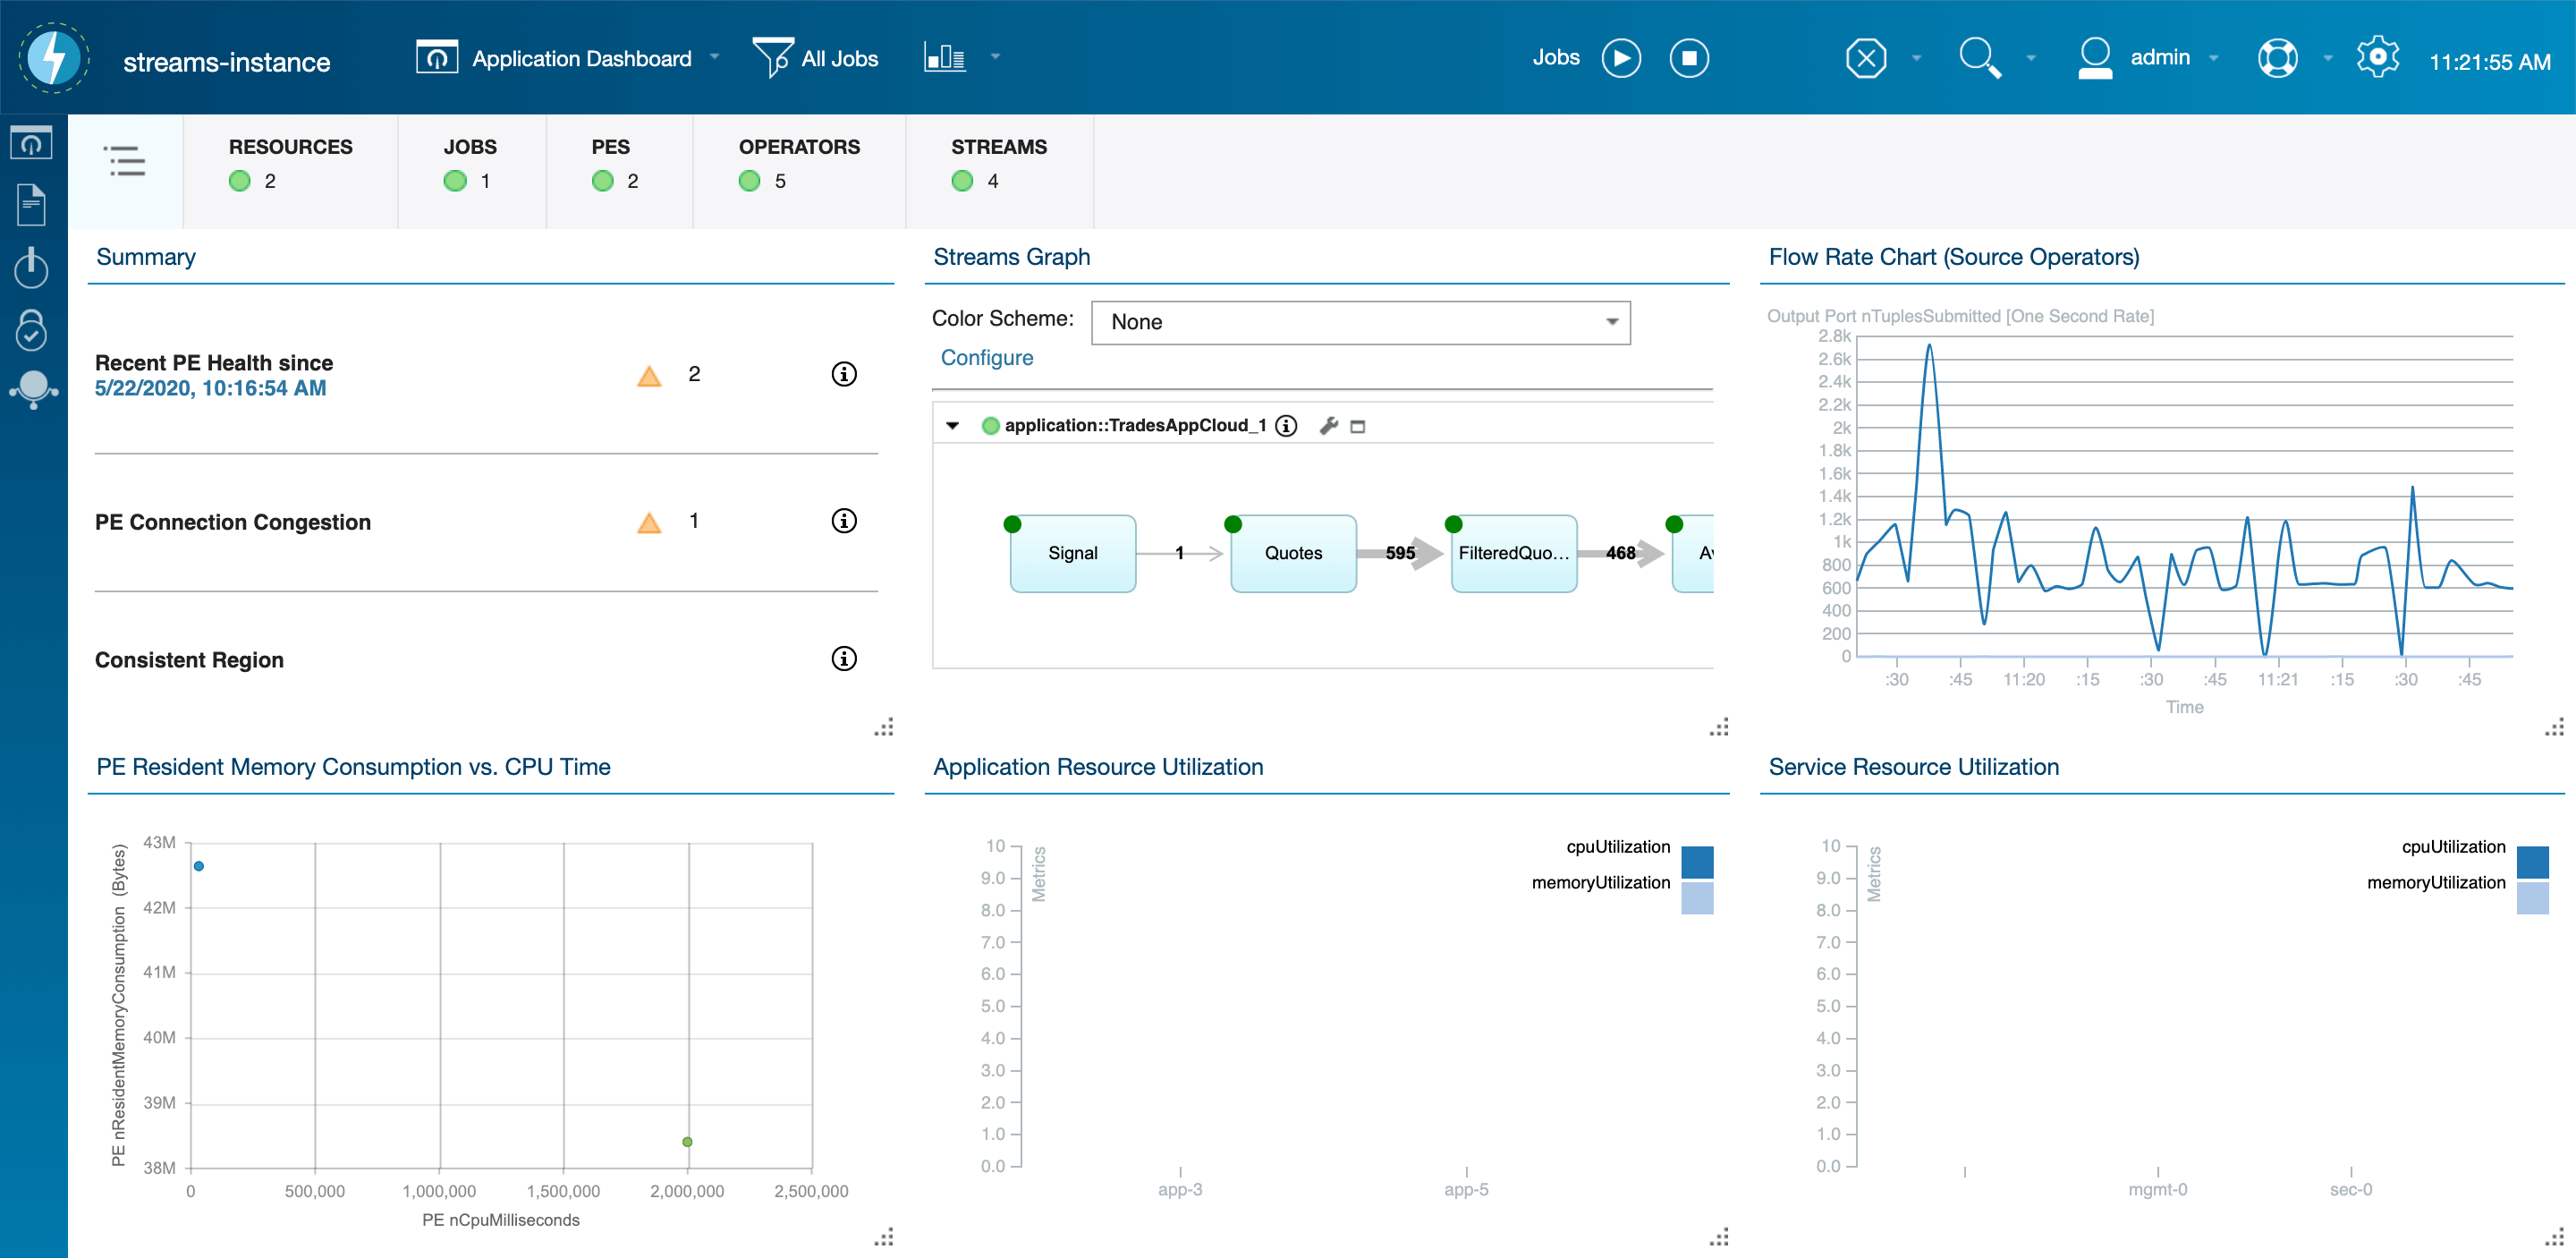
Edit meThe Streams Console is a web application that allows you to easily monitor and manage your Streams instance and jobs. You can quickly gain insights on the health, metrics, issues and performance of your applications and the systems they are running on.
In Streams on Cloud Pak for Data, the Streams Console is a more advanced alternative to the Job Graph.
This guide will cover how to perform the following tasks:
- Opening the Streams Console
- Submitting a Job
- Using the Streams Graph
- View a sample of streaming data
- Downloading logs
Streams Console
Opening the Streams Console
Opening the Streams Console will depend on your environment.
IBM Cloud Pak for Data deployment
Cloud Pak for Data 2.0-3.0
- In the IBM Cloud Pak for Data web client, open the navigation menu and click on My instances.
- Click on the Provisioned instances tab.
- Find your Streams instance in the list. If your IBM Cloud Pak for Data version is 3.0+, click on the instance. Otherwise, open the context menu for the instance and click on View details. You will be brought to the instance details page.
- In the Endpoints section, find the property called External Console endpoint and click on the corresponding link.
Cloud Pak for Data 3.5+
- In the IBM Cloud Pak for Data web client, open the navigation menu and click on Services > Instances.
- Find your Streams instance in the list and click on it.
- In the Streams external endpoints section, find and click the link for Console.
IBM Streams standalone deployment
These instructions assume that you already have an IBM Streams instance. If you need to install an instance, start here and follow the instructions.
To find the Console URL, see the documentation. Choose Finding the internal URLs for IBM Streams services or Finding the external URLs for IBM Streams services depending on whether or not you will be accessing the Streams Console from within the Kubernetes cluster.
IBM Streaming Analytics on IBM Cloud
These instructions assume that you already have a running IBM Streaming Analytics service. If you need to create a service, start here.
- Navigate to the Resource list in IBM Cloud.
- In the Services section, find your Streaming Analytics service in the list and click on it. You will be brought to the service's details page.
- Click on the Launch button. This will open the Streams Console.
Local installation of Streams v4.x
- From a terminal, run the following commands:
source $STREAMS_INSTALL/bin/streamsprofile.sh
streamtool geturl
This will print out a URL, like this:https://streamsqse.localdomain:8443/streams/domain/console - Open this URL in the browser and log in with your Streams credentials.
IBM Streams extension for Visual Studio Code
These instructions assume that you already have the IBM Streams extension for Visual Studio Code installed. If not, start here and follow the instructions.
- Click on the IBM Streams icon on the left side to bring up the Streams Explorer view.
- Hover over an instance node and then click on the Open IBM Streams Console icon that appears on the right. This will open the Streams Console in your browser.
Submitting a job
After opening the Streams Console, you can follow these steps to submit a job to run on your Streams instance. Streams applications are always compiled into a file with a .sab extension. SAB stands for Streams application bundle. This is a single, relocatable file that contains all the artifacts that are needed to run your application. Learn more about application bundle files here.
So, when we say “submit a .sab file”, we mean, run a compiled Streams application.
-
Click on the play icon in the header bar at the top.
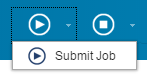
- Choose one of the options and point to your
.sabfile. - To configure the job submission, click on the Configure button. To submit the job with the default configuration, click on the Submit button. Learn more about job configuration here.
Streams Graph
This is a graphical view of your Streams Application. Here you can apply color schemes to display flow rates, operator and connection health, errors, and more.
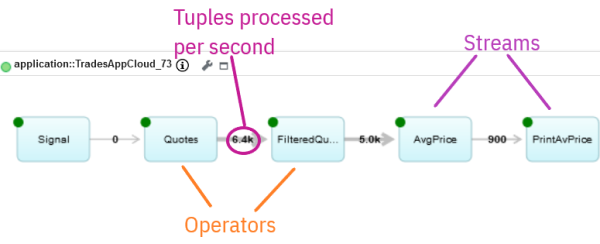
A Streams application displayed in the Streams Graph. Rectangles are operators and the arrows are Streams.
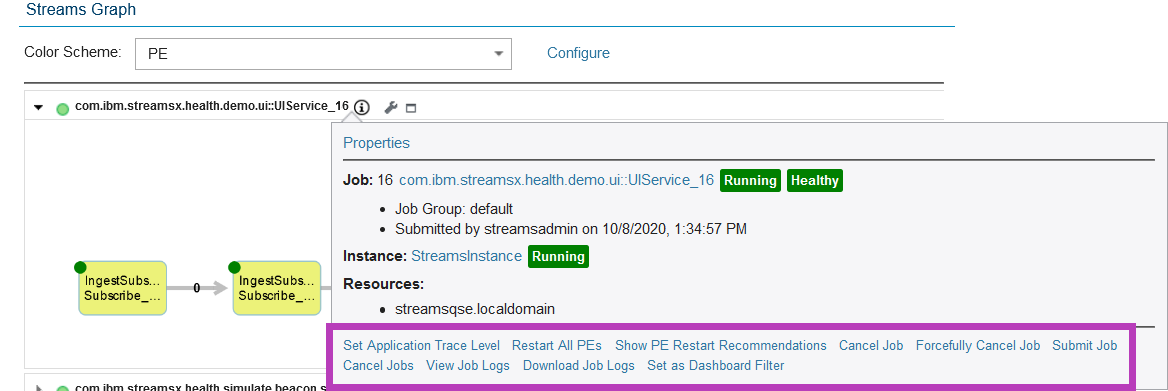
Managing and Monitoring Jobs in the Streams Graph
Hover over an operator, a job, or a Stream to see available actions. These include:
- Set application trace
- Restart PEs
- Submit a job
- View PE restart recommendations
- Download operator and PE logs
- Modify parallel regions
Displaying streaming data with Views
A View is a connection to a particular Stream in a running application that allows you to see a sample of the data in the Stream.
Views can be defined in an SPL with the @view annotation, or in Python with the Stream.view function.
Once the application is running, you can use the View to observe the data on the stream. Additionally, Views can also be added at runtime to a job, with some exceptions.
To add a view or inspect the data in a View, you can also use the Streams Console or the Job Graph in IBM Cloud Pak for Data.
Quick facts about views
- Views provide a sample of the data on a Stream, and not all the tuples on the Stream.
- Use a View to fetch data from a Stream only while the application is running.
- The data retrieved by the View is read-only, so you cannot use a View to change the tuples on a Stream.
Displaying an existing view
- In the Application Dashboard, hover over the menu in the top left corner.
- In the popup that appears, expand the instance, and expand the Views node. This will display a list of views in all applications in the instance.
Find the view based on the application name and the view name, and click on it.
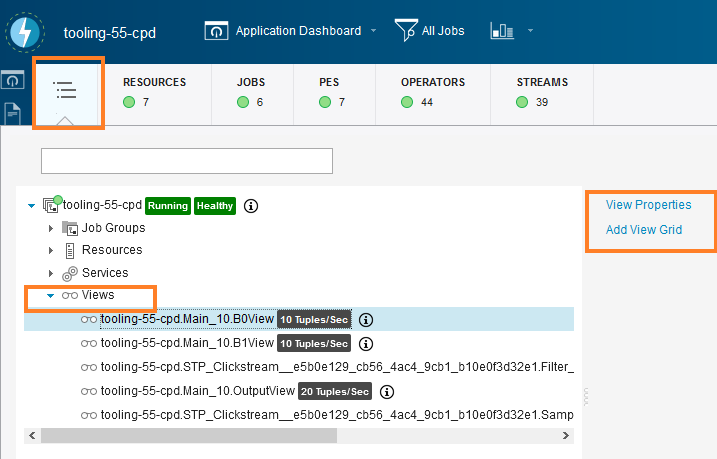
Click Add View Grid. This will add a new card to the console showing the data from the grid.
Adding a view to a running application
If you did not add a view in the application's source, you can still do so from the Streams Console:
- In the Application Dashboard, find the Streams Graph card and expand it.
- Hover over the stream that comes out of an operator and right-click.
- Select Create Dashboard View.
- Accept the default options and click on the OK button.
- Minimize the Streams Graph card.
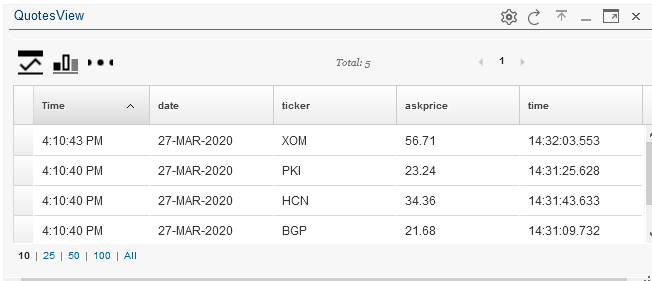
- A new card is created in the dashboard that displays the tuples in the stream produced by the operator. Notice that the view is updated as new data arrives.
These steps are demonstrated in the following animation.
Customizing the Streams Console with charts:
Monitor metrics and health through various configurable charts like pie charts, bar charts, scatter charts, etc. and grids.
How to do it:
-
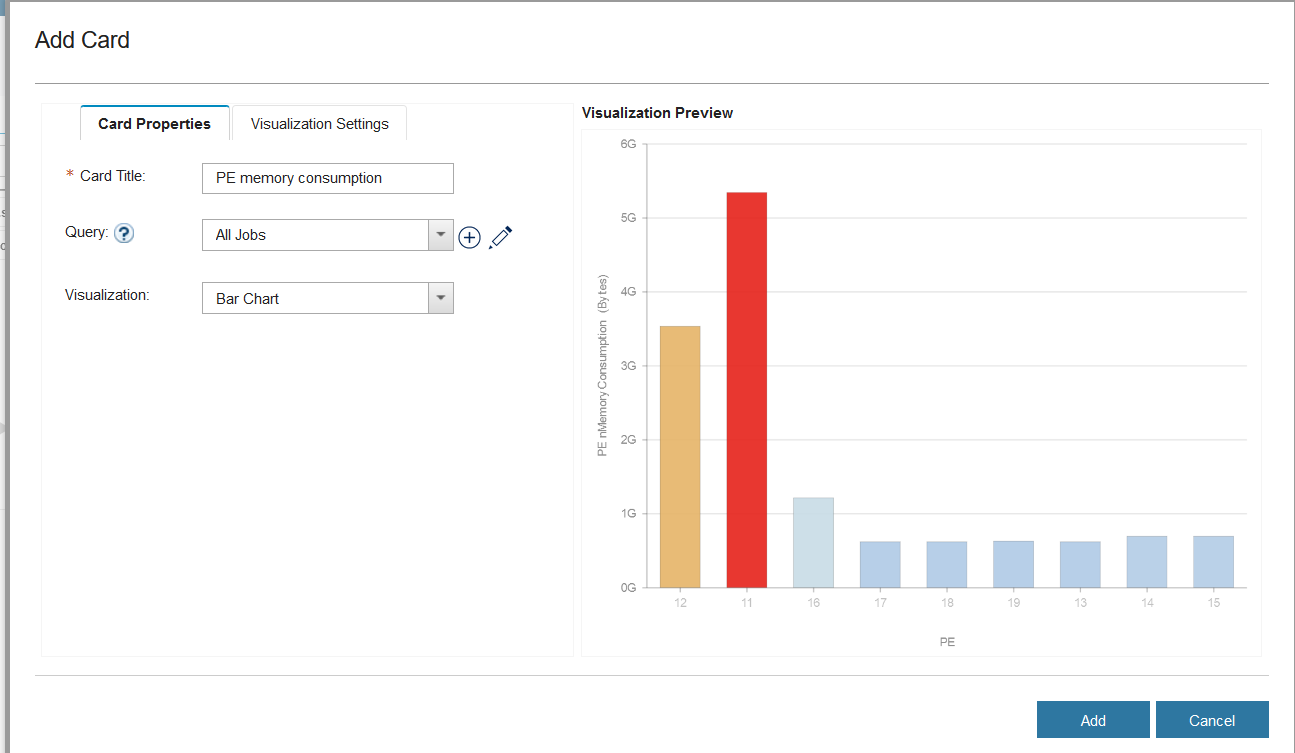
Click Add card in the console
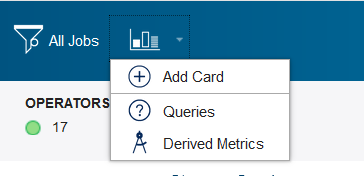
-
In Visualization Settings tab, choose a type of metric, e.g. PE memory consumption, and in the Card Properties, select the type of graph, e.g. bar chart.
Download and View Logs
Analyze application trace, product and console logs through a reader friendly viewer.
How to use it:
-
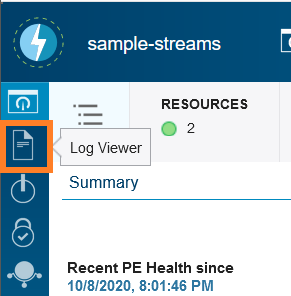
Open the log viewer from the far-right pane of the Streams Console.
-
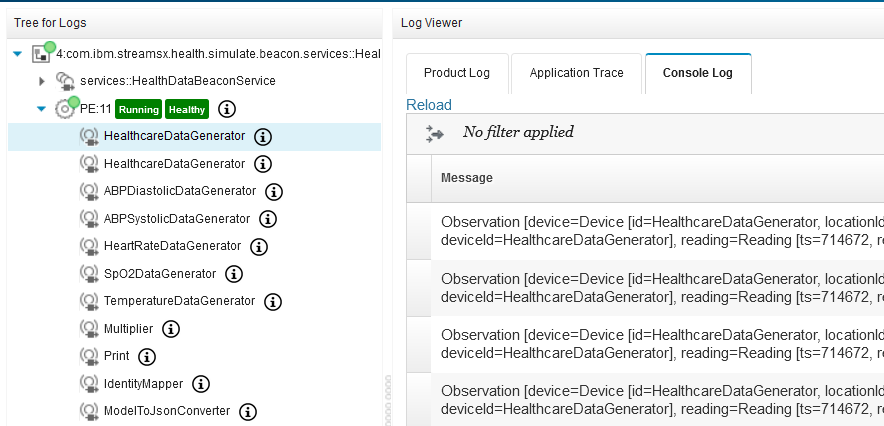
Select the job of interest. Expanding the tree and selecting an operator or PE will open the logs pane. Click any of the tabs: Application trace, Console log or Product log to show trace data, messages printed to standard out, and product logs, respectively
Cancel a Job
-
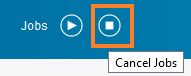
Click the Cancel Jobs button in the toolbar.
-
Select the job(s).
-
Click Cancel jobs.