Run your first IBM Streams application with Visual Studio Code
Edit meYou can use Microsoft Visual Studio Code (VS Code) to edit and deploy Streams applications. You do not need to download the Streams runtime, but only the Streams extension for VS Code.
This guide will walk you through deploying and monitoring a Streams application from using VS Code.
Prerequisites
-
You need access to an instance of IBM Streams on Cloud Pak for Data or the Streaming Analytics service.
-
You should have set up the Streams extension for VS Code. Specifically, follow the steps in the documentation to:
After completing these steps, you’re ready to run and import the sample.
Import the sample application
The TradesApp sample application processes a stream of stock quotes for various companies, each identified by an id, or ticker.
It computes the rolling average price for each unique stock ticker and prints it to standard out.
- Download the sample application project from here.
- Extract the zip files into a folder.
- Import the application into VS Code:
- Go to File > Open… (or Add Folder to Workspace…).
- Browse to the project folder and click on Open (or Add).
Compiling the application
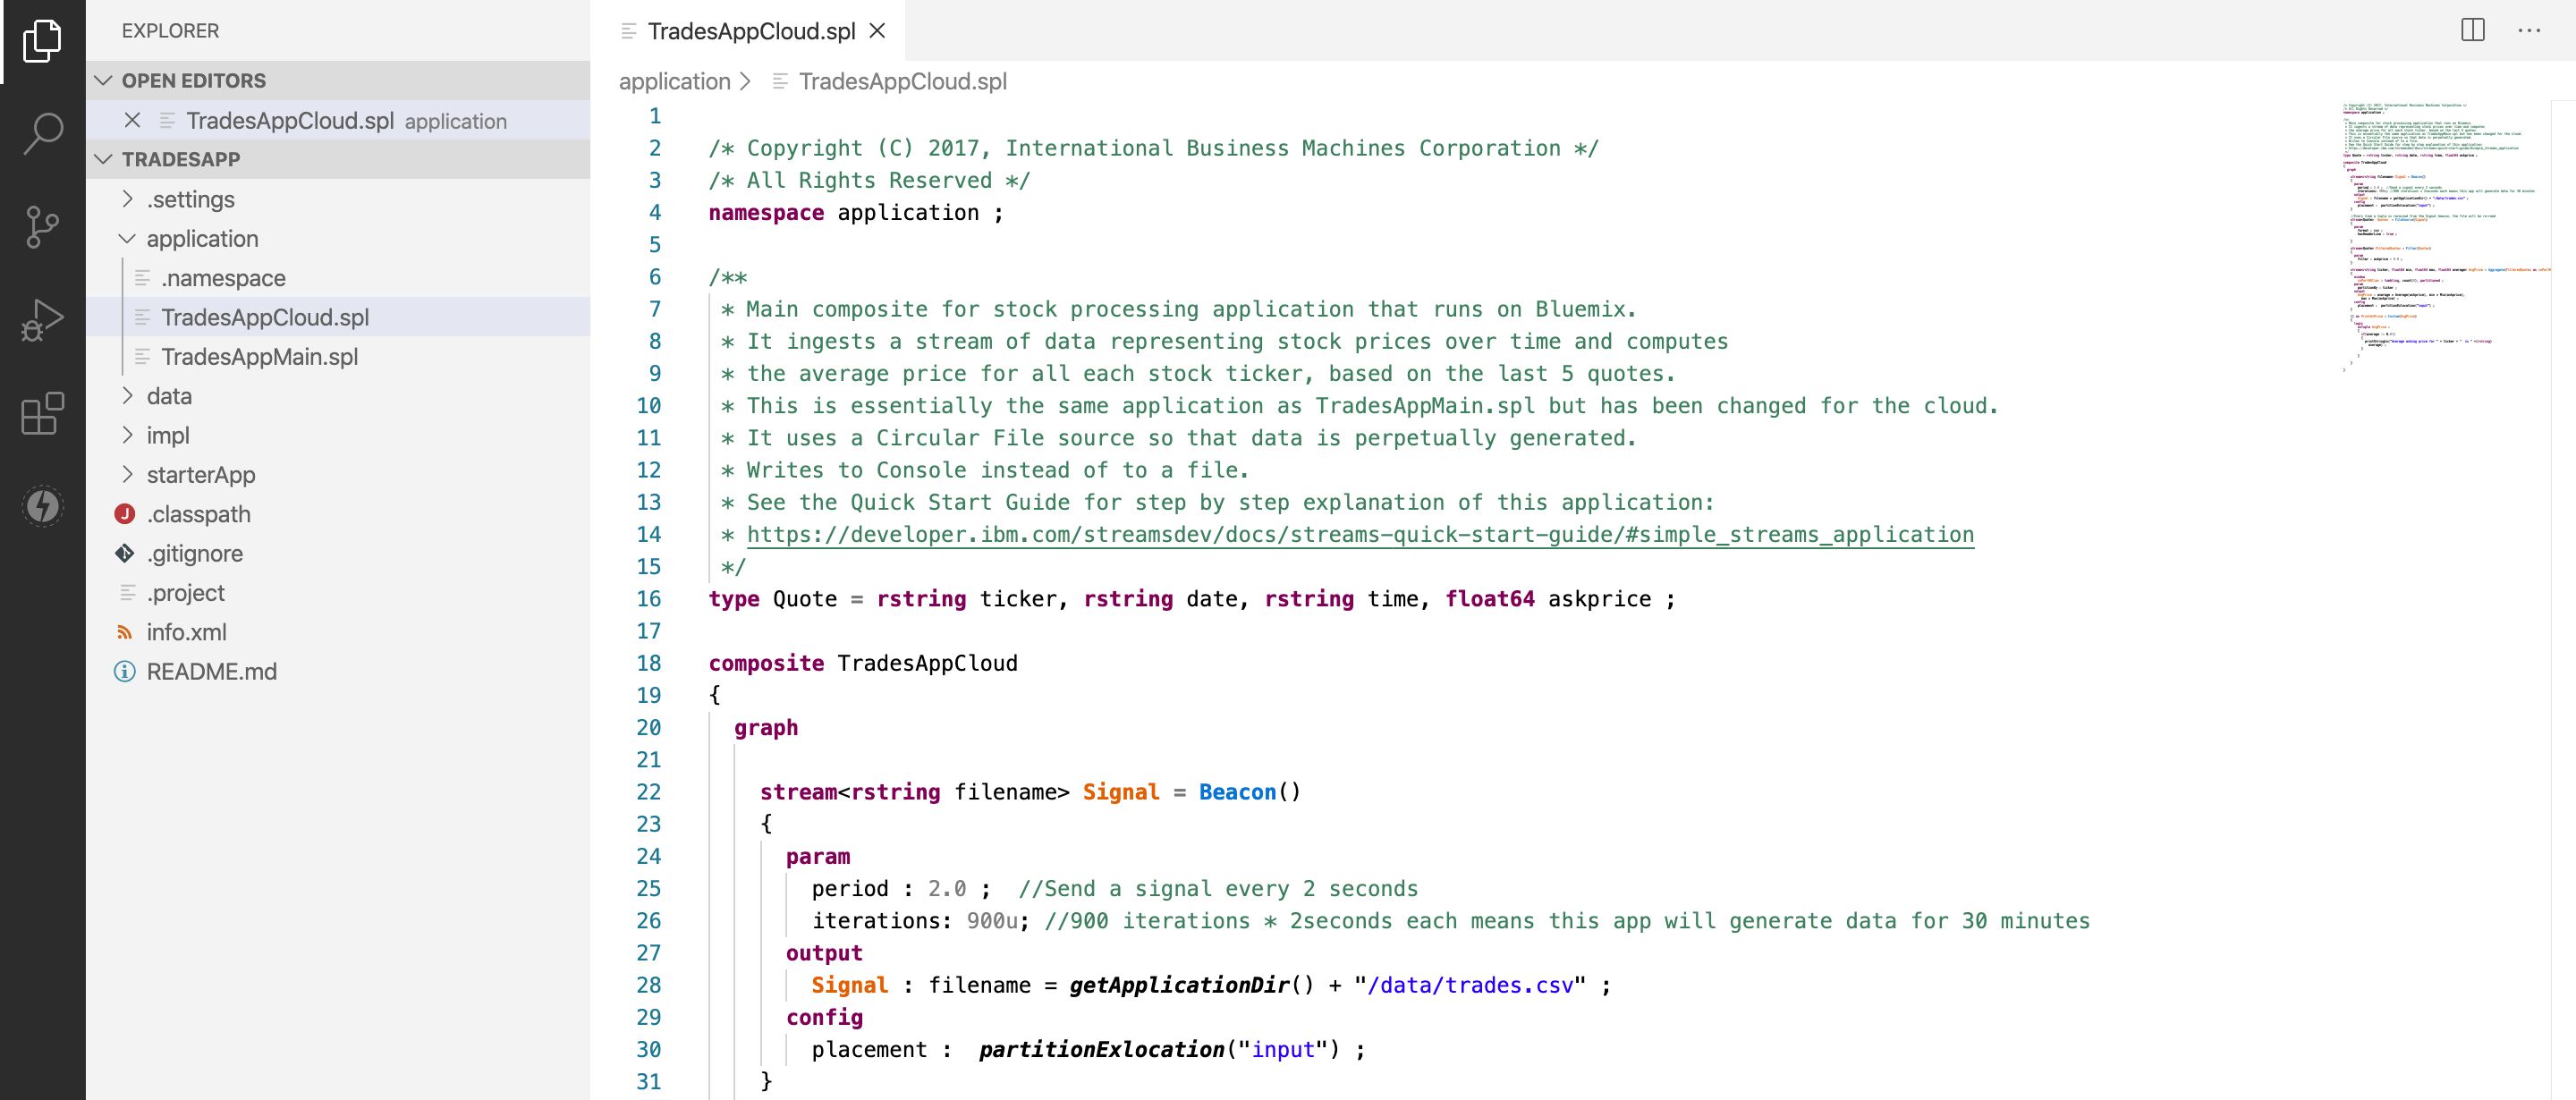
- Bring up the Explorer view on the left and expand the
applicationfolder. - Then, either:
- Right-click on the
TradesAppCloud.splfile. - Double-click on the
TradesAppCloud.splfile to open it in the editor and right-click in the editor.
You will see two build options:
- Build: Builds your Streams application and downloads the application bundle (
.sab) to the application’soutputfolder. - Build and Submit Job: Builds your Streams application and submits it directly to a Streams instance of your choice. -
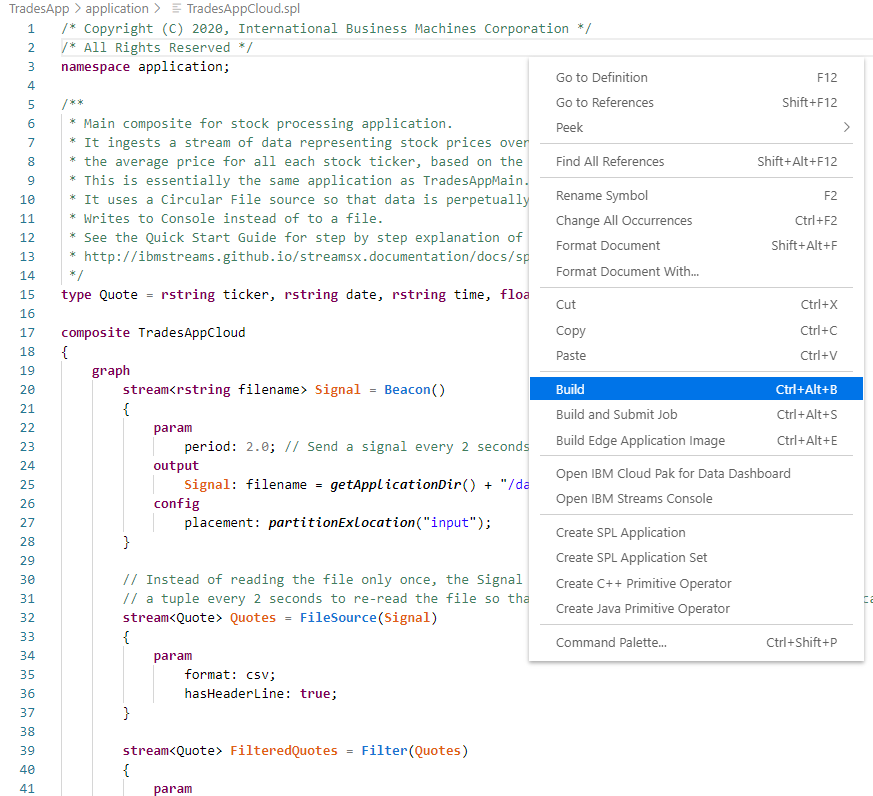
- Right-click on the
- Select Build.
This will build the application using the Streams instance you added previously. As the build progresses, you will see notifications appear in the bottom right corner and the build output will be displayed in the application’s output channel in the OUTPUT panel at the bottom.
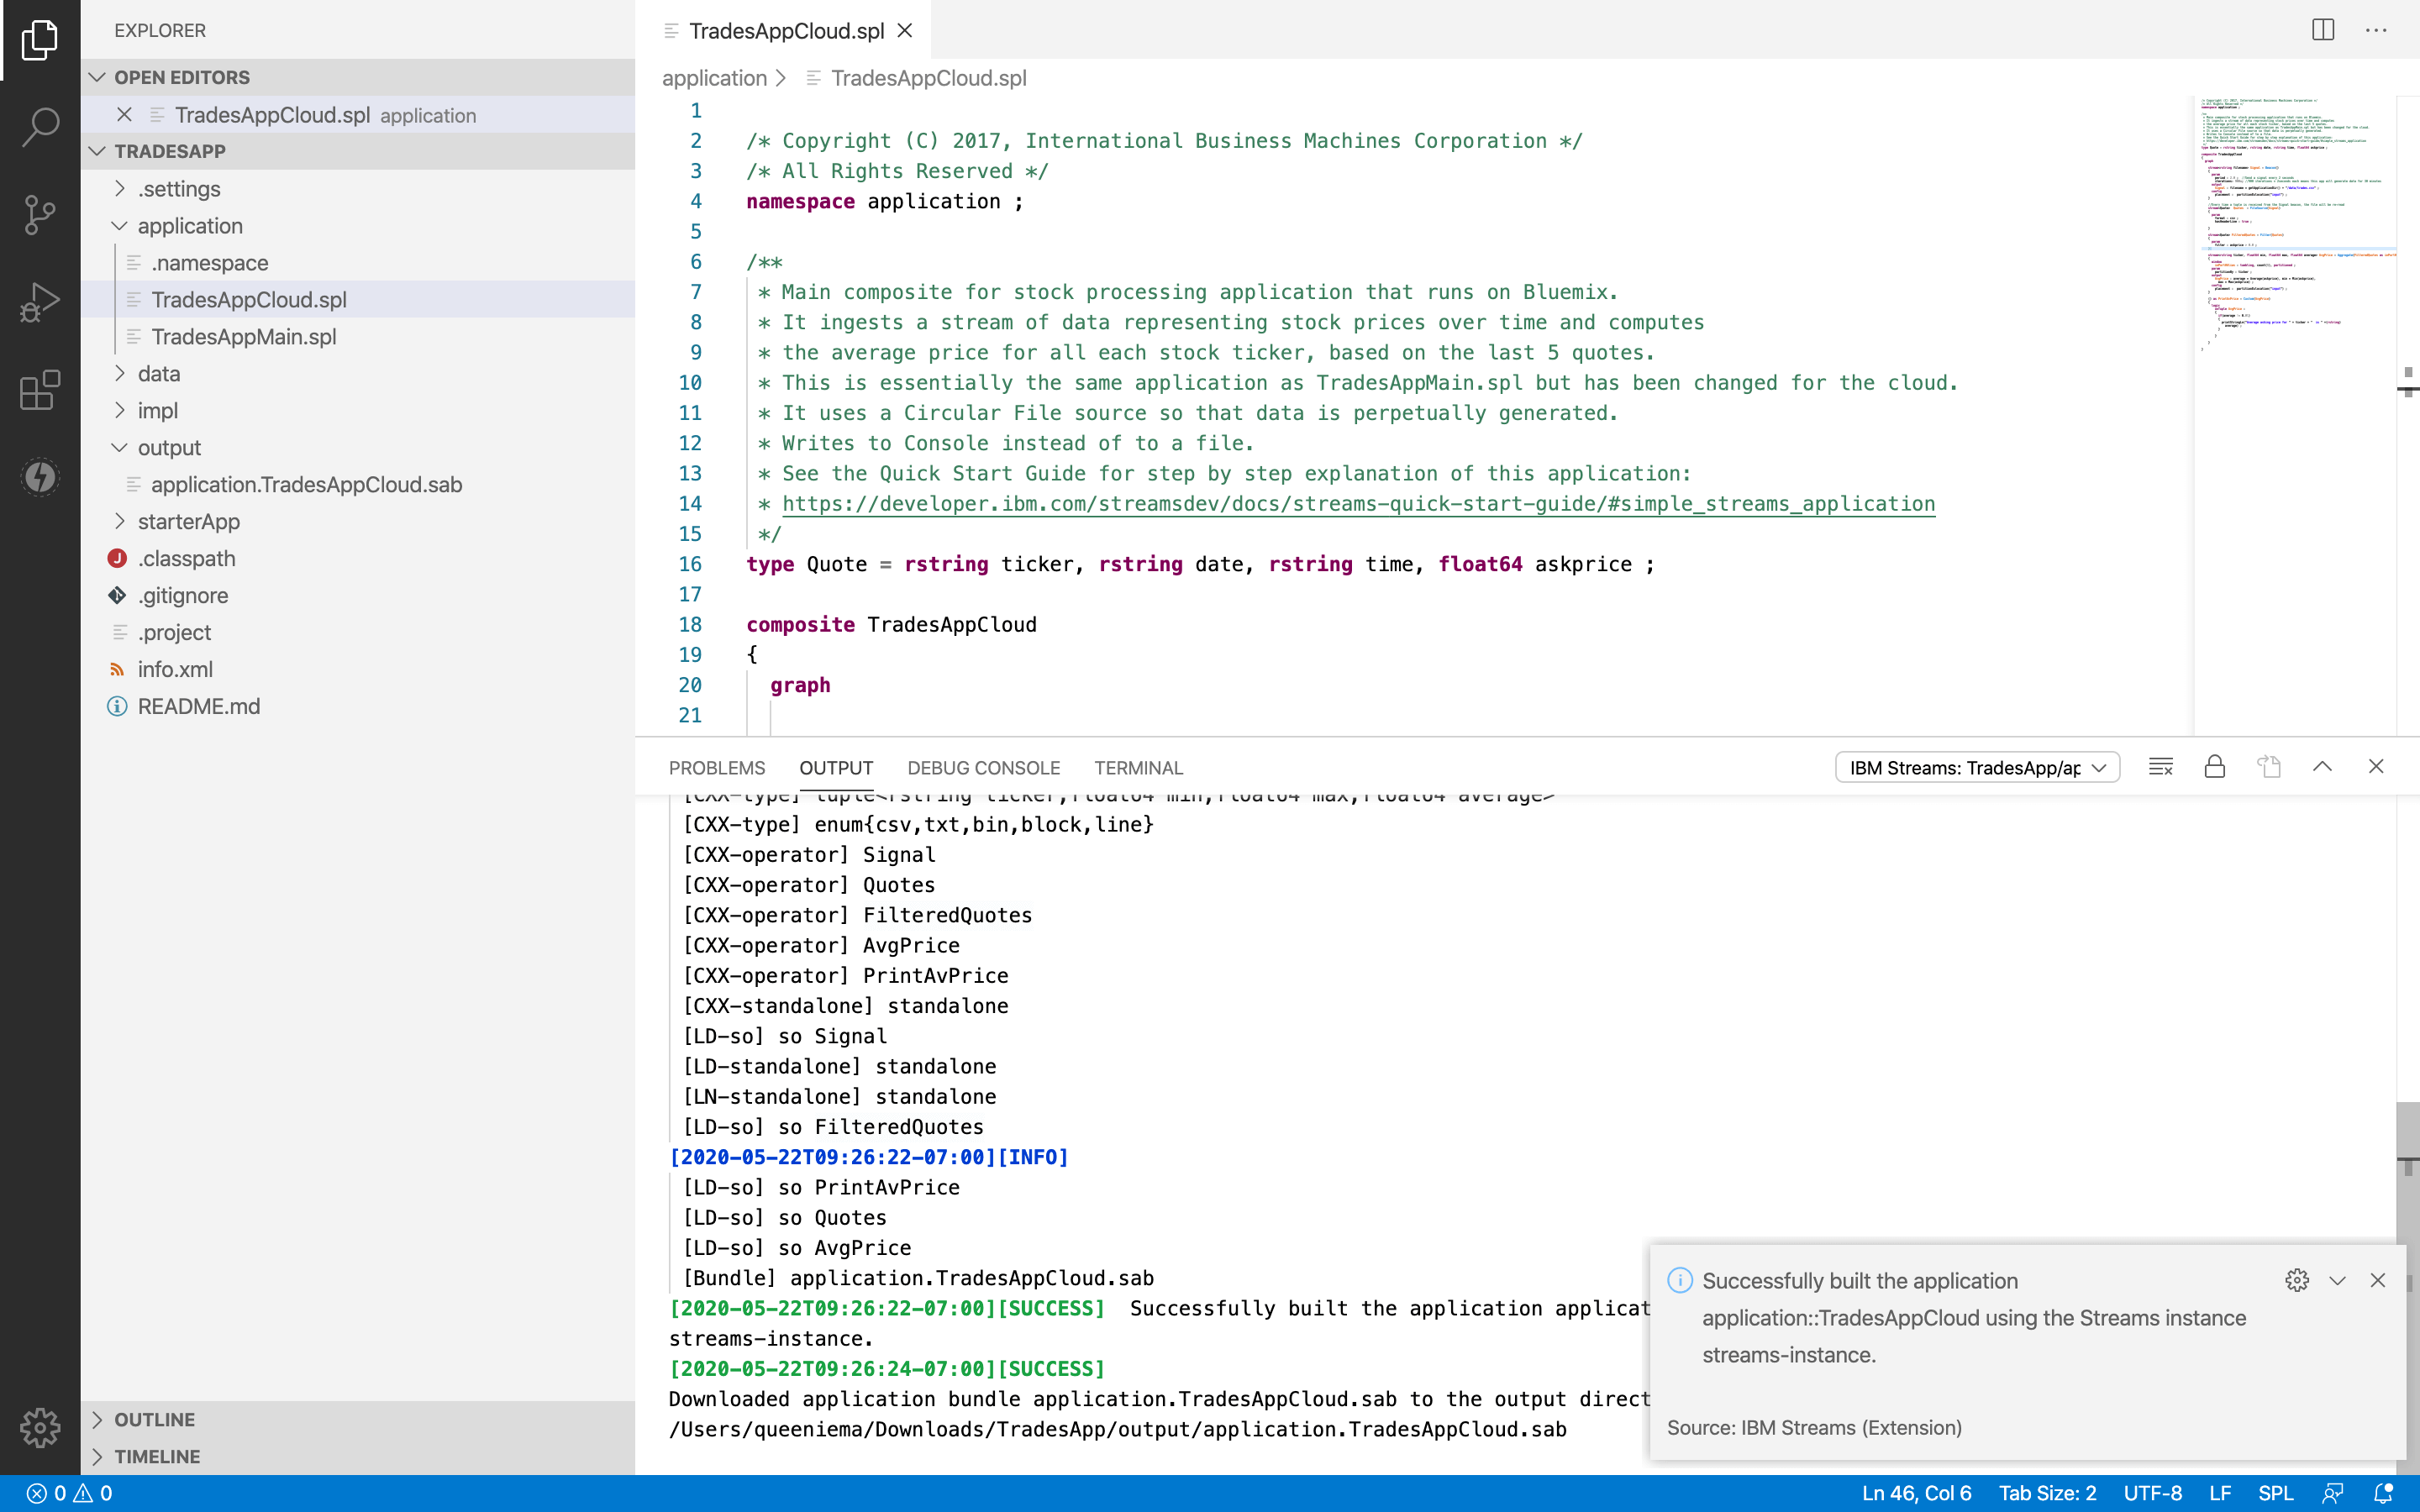
Once the build finishes successfully, a Streams application bundle file called application.TradesAppCloud.sab is generated in the project’s output folder. We will use this in the next step to run the application.
Run the application
To run the application, you will need to submit the bundle file from the previous step to your Streams instance. Note that a running Streams application is called a job.
- Bring up the Explorer view on the left and expand the
outputfolder. - Right-click on the
application.TradesAppCloud.sabfile and select Submit Job. - You will prompted for the job configuration before the job is submitted.
- If you are using Cloud Pak for Data v3.5 or newer, you will need to specify a job definition name. This is the name that is used to group all executions of this job in Cloud Pak for Data.
- You can also optionally specify a Streams job name. This is to identify the job within the Streams instance.
- For more advanced configuration options, click Show all options to upload a job configuration overlay JSON file, provide a description for the job, and more.
- This application has no parameters, so click Submit job.
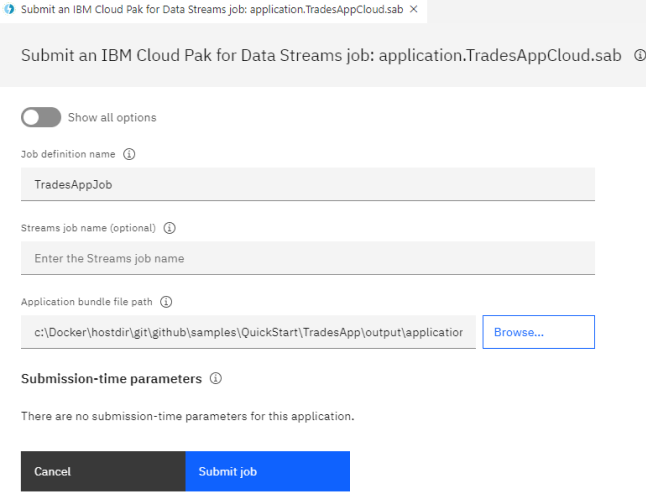
*Submit Job page. The job submission options depend on the Streams instance you are using.*
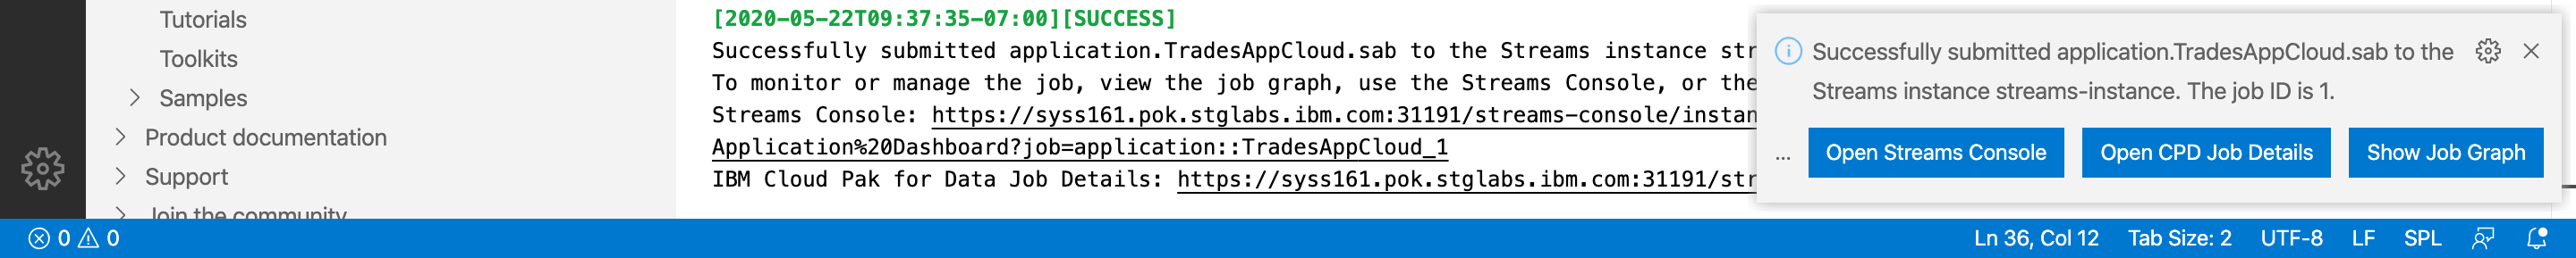
This will submit the application to the Streams instance you added previously. As the submission progresses, you will see notifications appear in the bottom right corner and the submission output will be displayed in the IBM Streams output channel in the OUTPUT panel at the bottom.
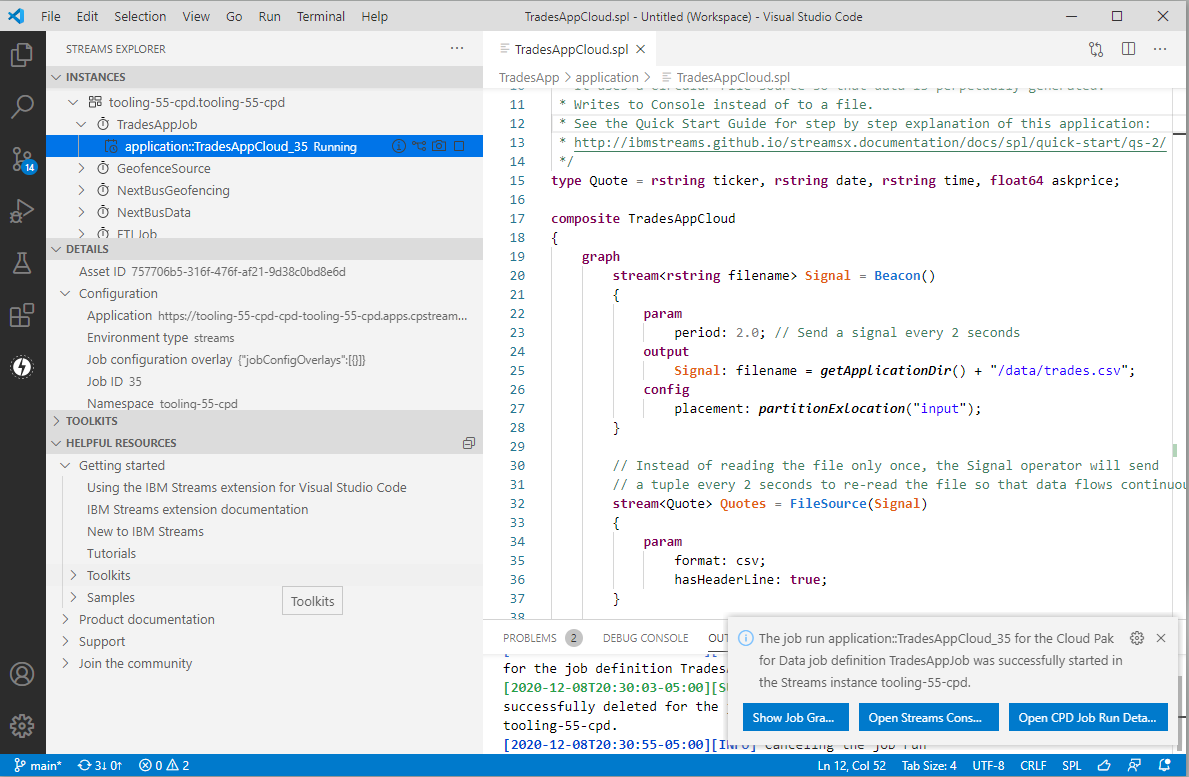
Once the submission finishes successfully, the TradesAppCloud application will be running in your instance! The success notification in the bottom right corner will show you some options to work with your new job. We’ll cover them in the next step.
You can see the new job by clicking on the Streams icon on the left to bring up the Streams Explorer view. When you select the job in the INSTANCES pane, the DETAILS pane will update to display the job details.
Monitor the running application
Once your application is running, you may want to monitor the job. The steps to do this depend on the version of the Streams instance you added.
Use the Job Graph in VS Code to monitor the running job.
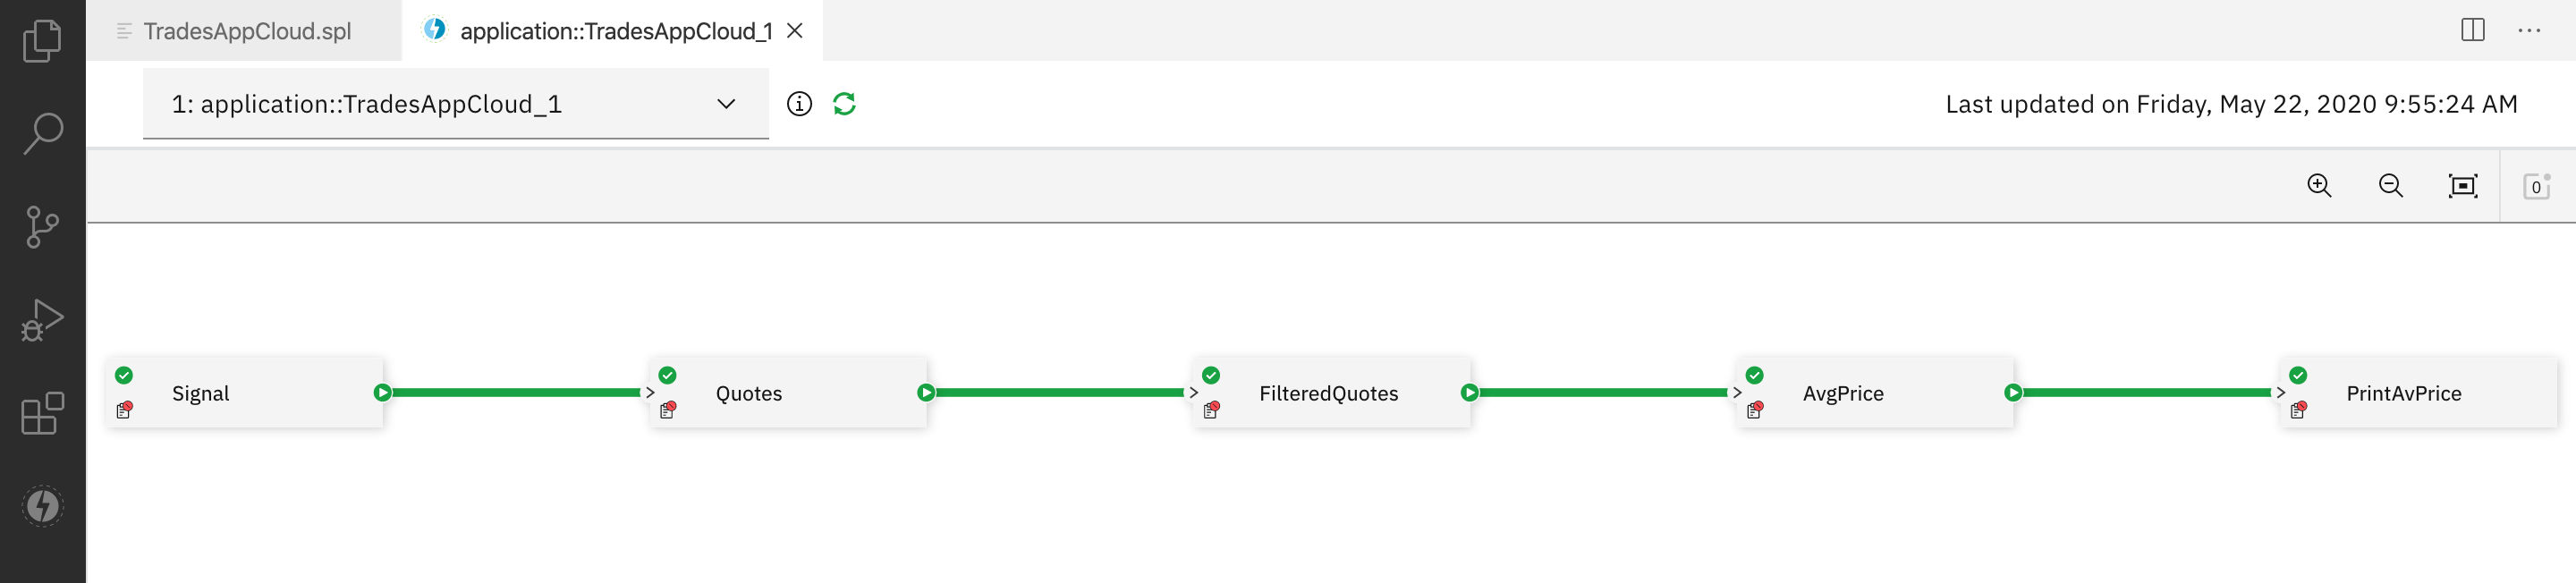
Job graph overview
The job graph allows you to easily visualize and monitor your Streams jobs. Streams applications are really directed graphs that analyze data as it is processed. Each node in the graph is an operator that processes data, and each link represents a stream of live data.
Some of the useful features include:
- Monitor metrics and flow rates
- View flowing data
- Highlight nodes by branch, upstream, or downstream
- Color nodes by PE
- Set the trace level for a PE
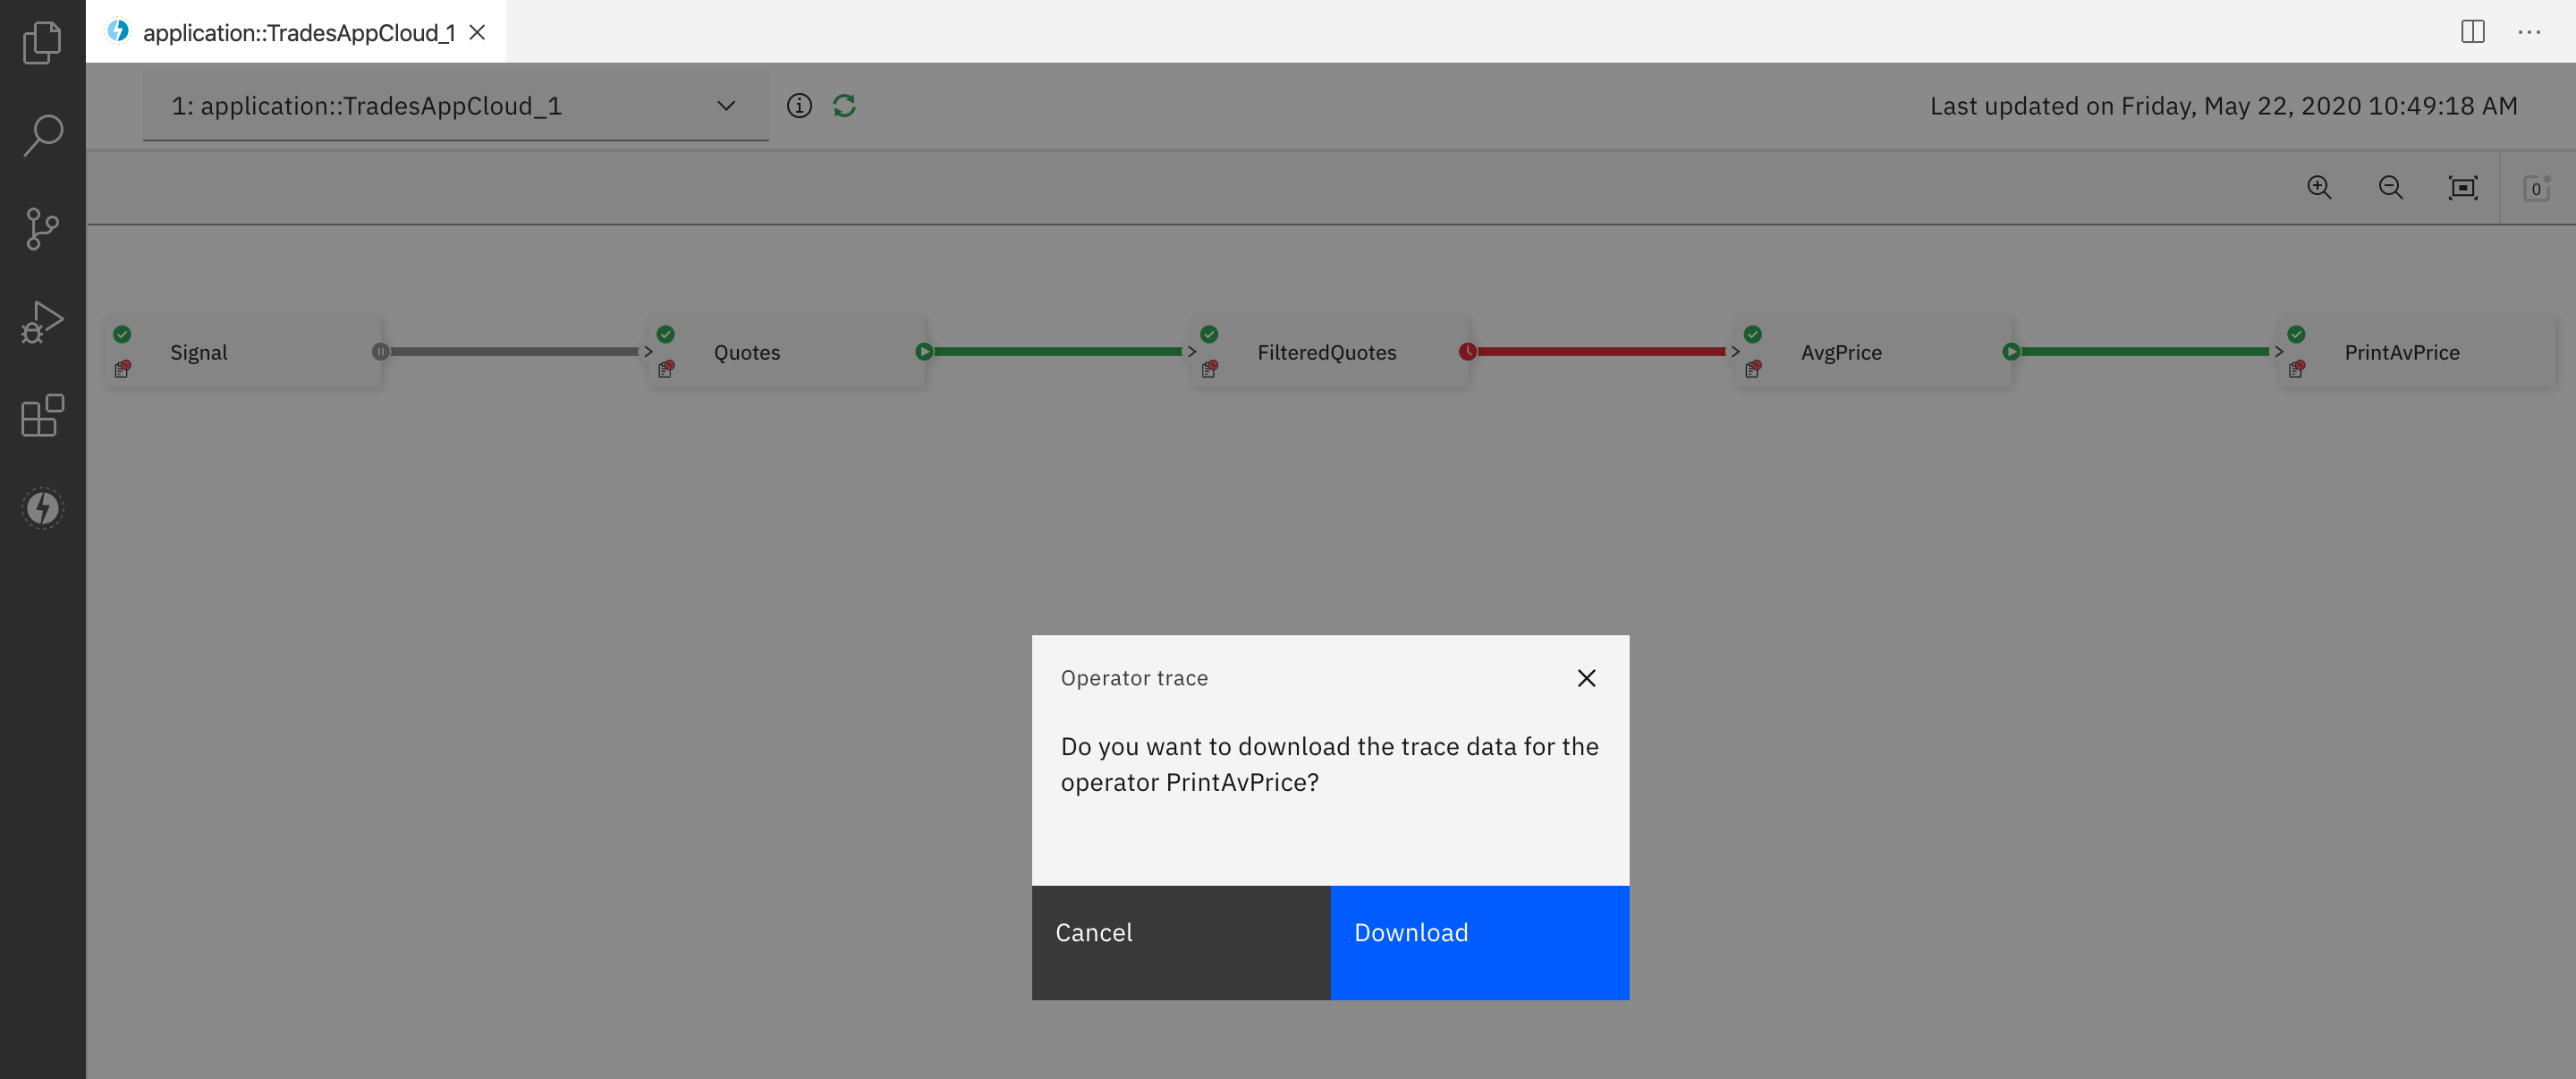
- Download operator trace data
- Restart PE(s)
- Delete job(s)
The following animation demonstrates a few of these features.
Launching the job graph
You may launch the job graph in VS Code in one of the following ways.
-
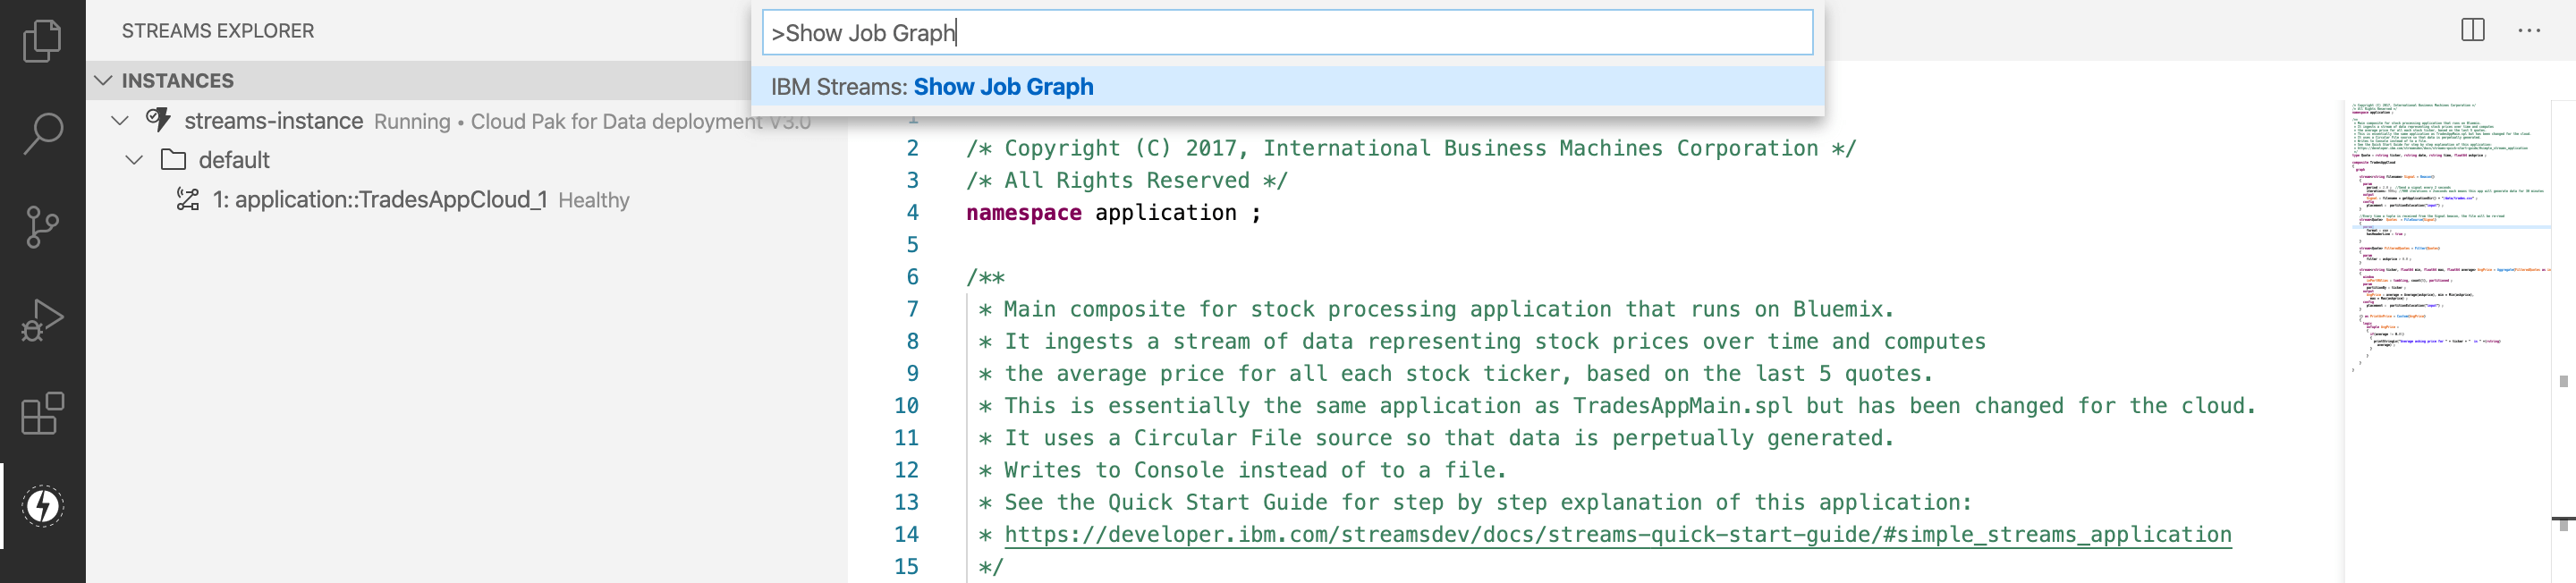
Execute the Show Job Graph command from the Command Palette. This will display an empty graph in the context of the default Streams instance and you may select a job from the dropdown at the top.
-
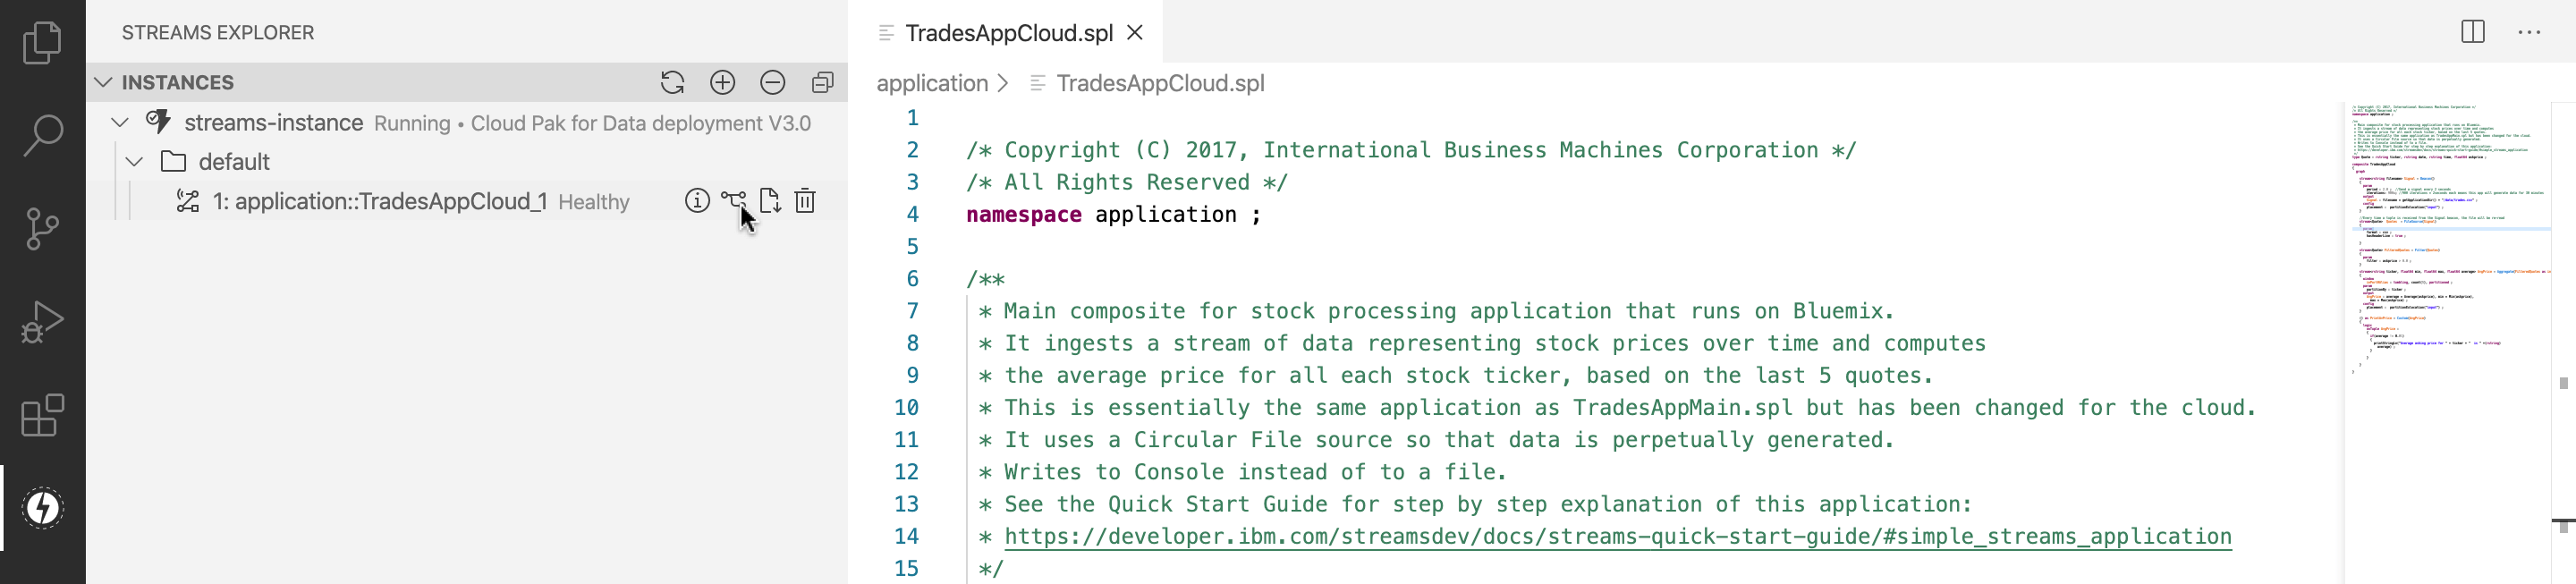
In the Streams Explorer view, hover over a job node and then click on the Show Job Graph icon that appears on the right. This will display the graph for the selected job.
-
After you successfully submit an application, a notification will be displayed in the bottom right corner of VS Code. Click on the Show Job Graph button in the notification to display the graph for the newly submitted job.
To switch the job that is displayed in the graph, simply select a different job from the dropdown at the top. You may also open multiple graph instances at a time using any of the methods above.
Observe the data flowing through the job in real time
Quotes operator produces a stream of stock quotes. Let’s take a look at the data.
- Hover over the link that comes out of the
Quotesnode and right-click. - Select View data > Create new view.
- A panel appears at the bottom that displays the tuples in the stream produced by the
Quotesoperator. Notice that the view is processed as new data arrives.
View application logs
All application output, including messages printed to standard out, errors, and trace data are sent to the logs.
- To view an operator’s logs, click on the trace icon in the bottom left corner of a node.
- To view the logs for an entire job, bring up the Streams Explorer view. Hover over a job node and then click on the Download Job Logs icon that appears on the right.
You may use the Streams Console to monitor the running job.
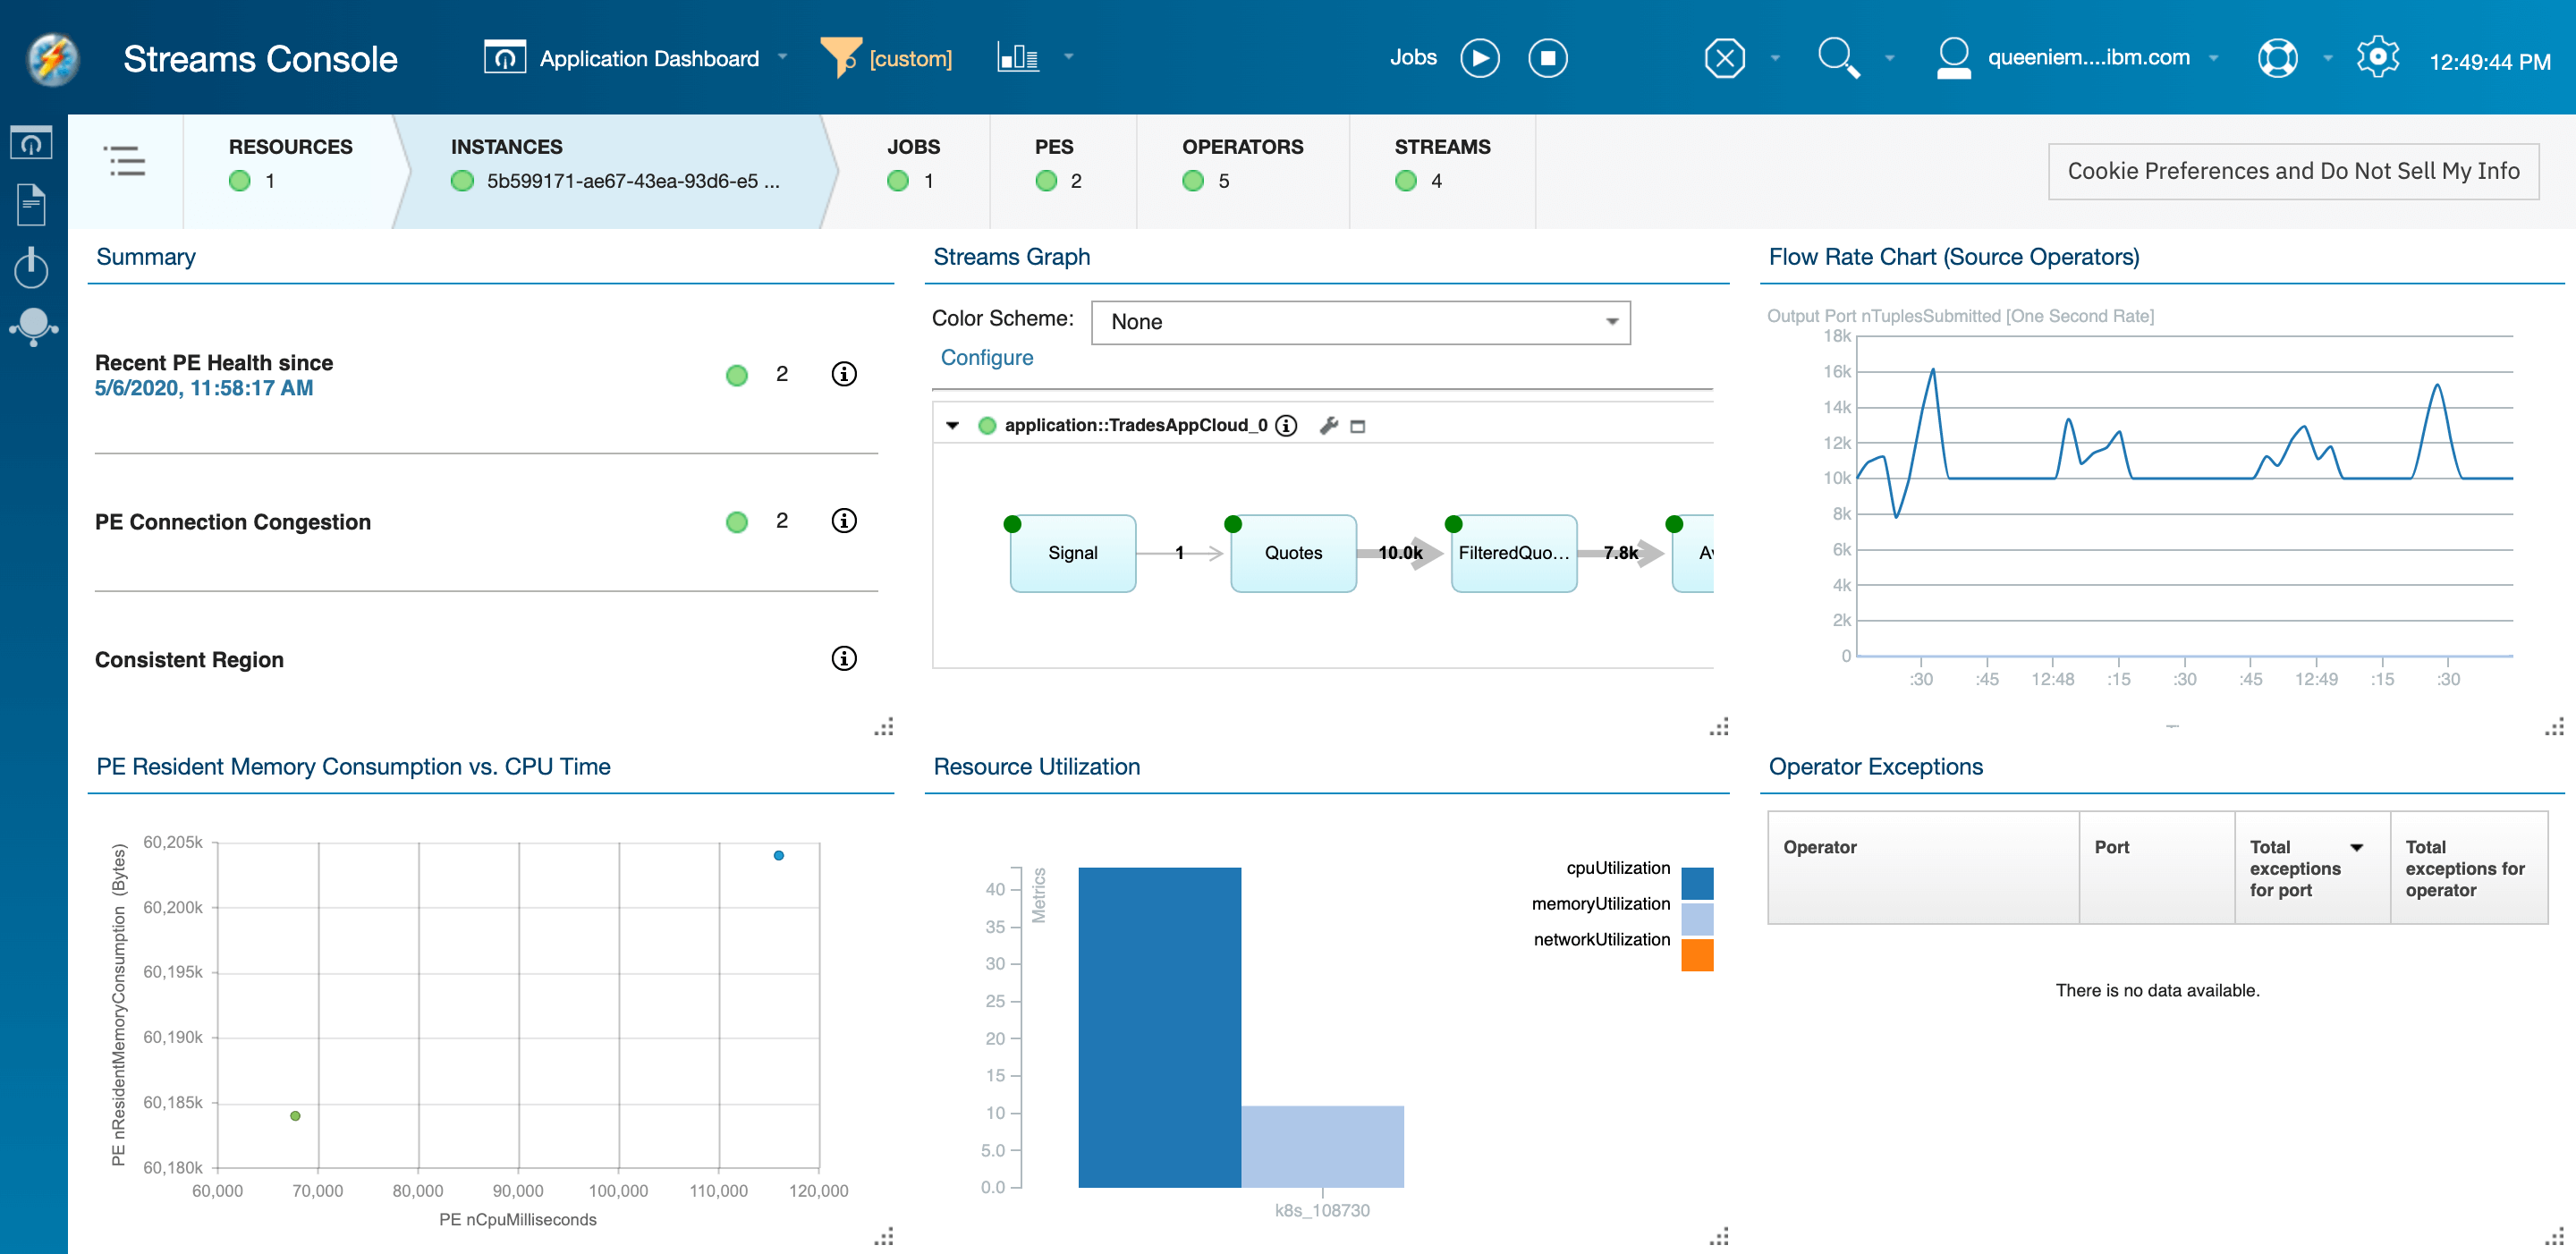
Streams Console overview
The Streams Console is an integrated console that runs in your browser. You can use it to manage your instance and resources, configure security, and monitor jobs from a single location. Its sleek and efficient interface lets you quickly gain insights into the health, metrics, issues, and performance of your Streams instance.
Launching the Streams Console
You may launch the Streams Console in one of the following ways.
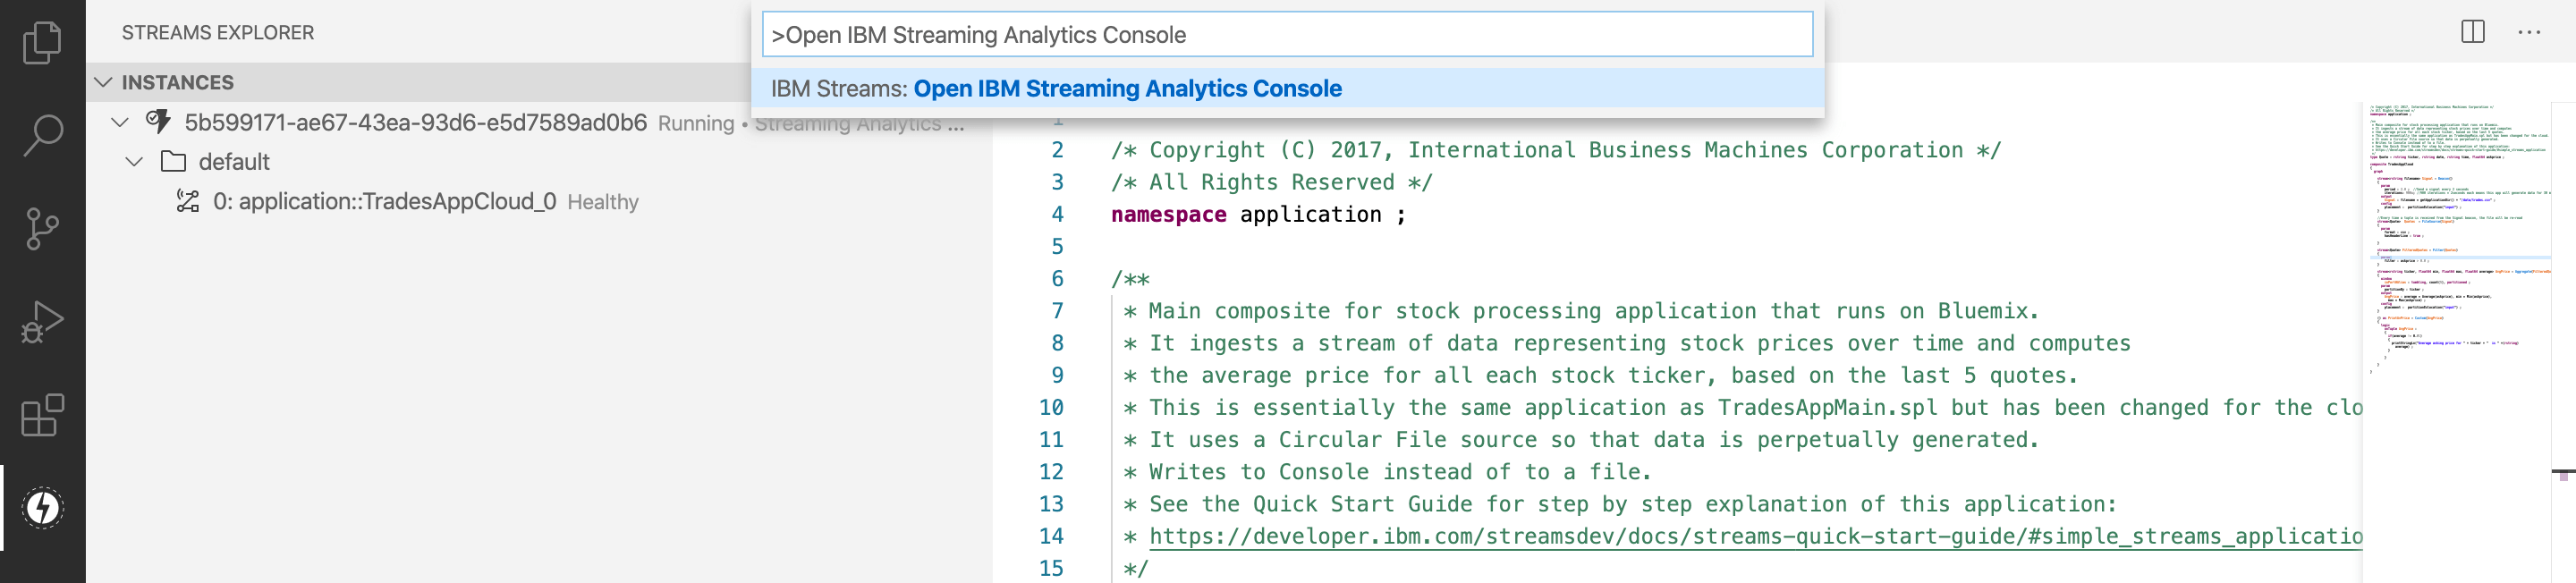
-
Execute the Open IBM Streaming Analytics Console command from the Command Palette. This will open the Streams Console in your browser.
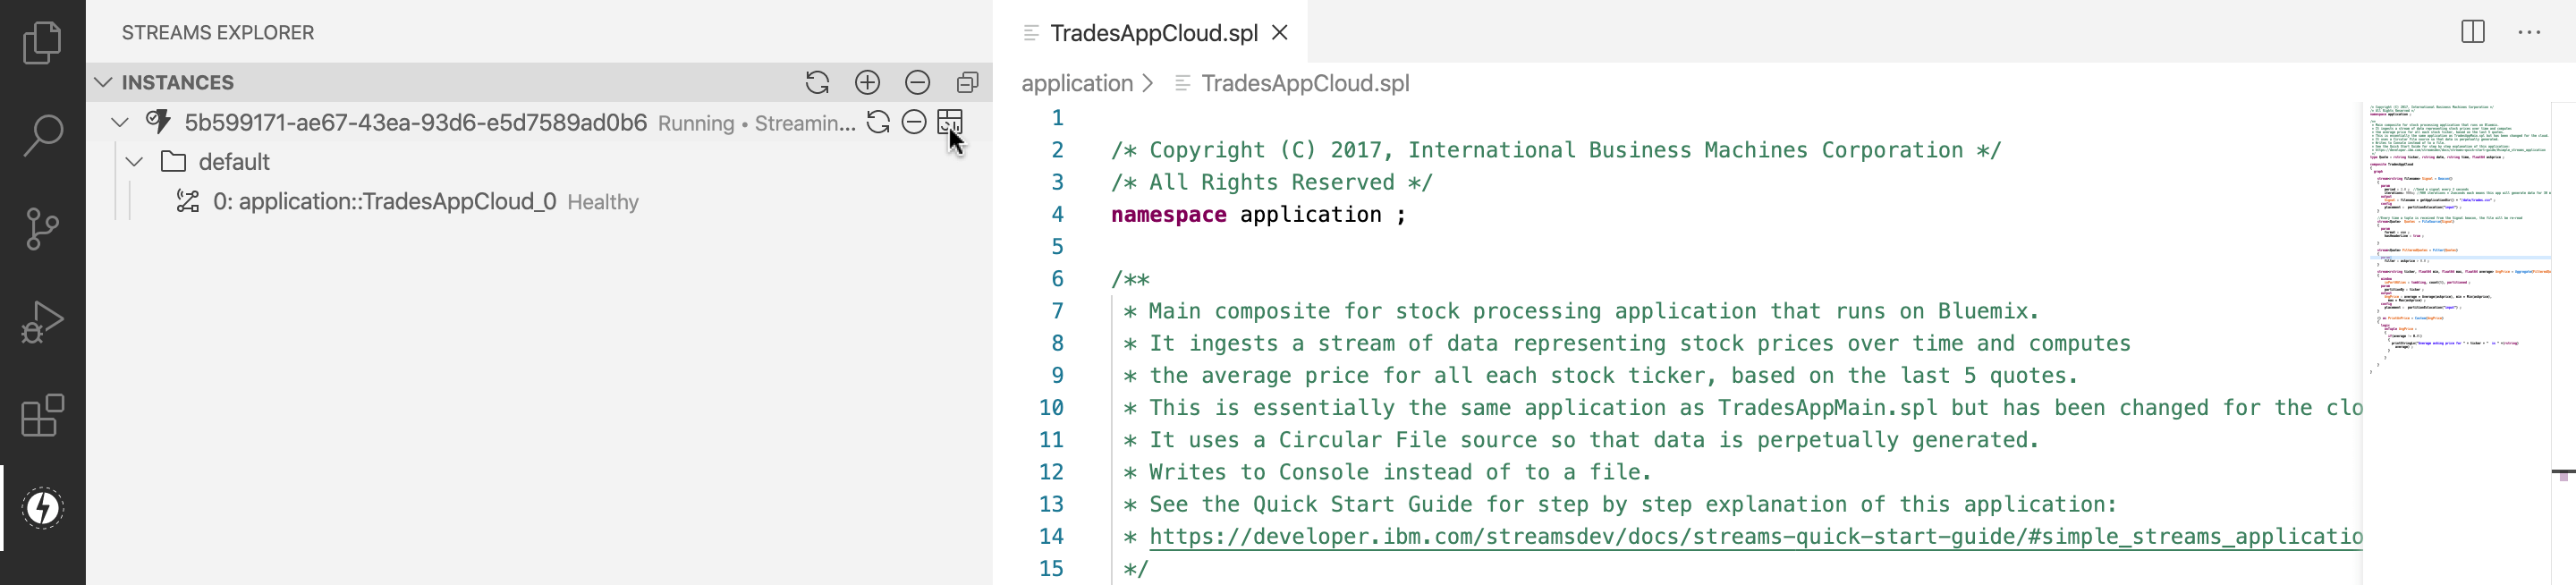
-
In the Streams Explorer view, hover over an instance node and then click on the Open IBM Streaming Analytics Console icon that appears on the right. This will open the Streams Console in your browser.
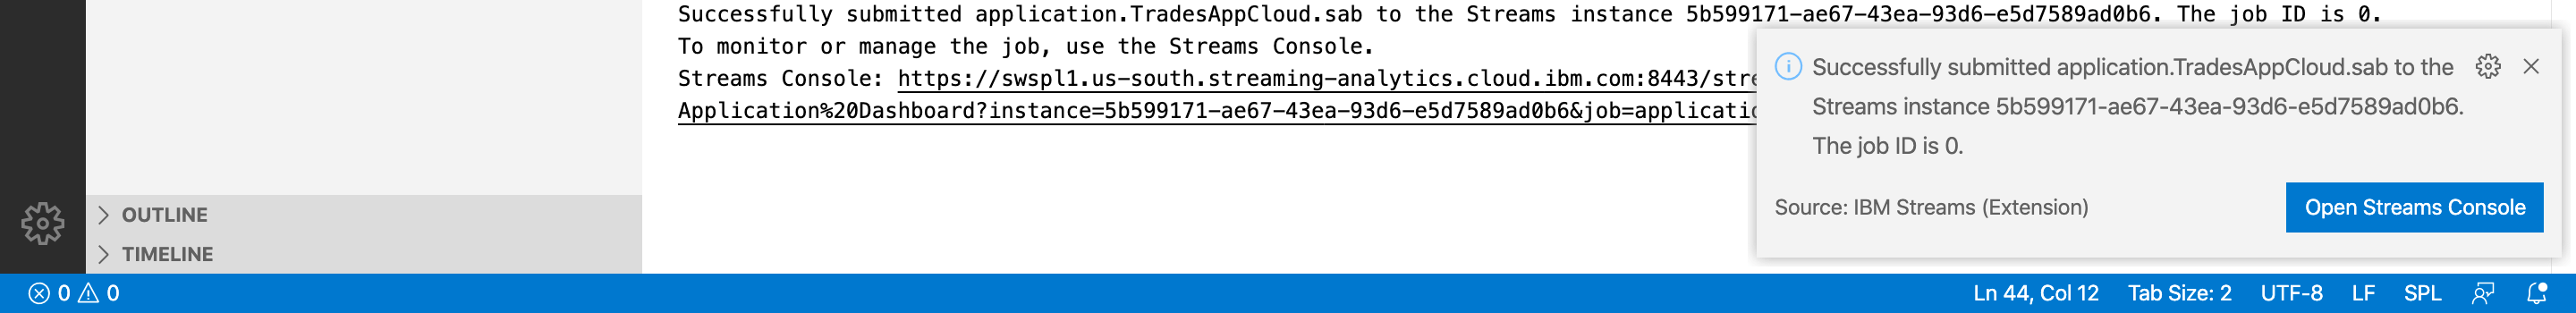
-
After you successfully submit an application, a notification will be displayed in the bottom right corner of VS Code. Click on the Open Streams Console button in the notification to open the Streams Console in your browser.
To view the graph for a job, expand the Streams Graph card.
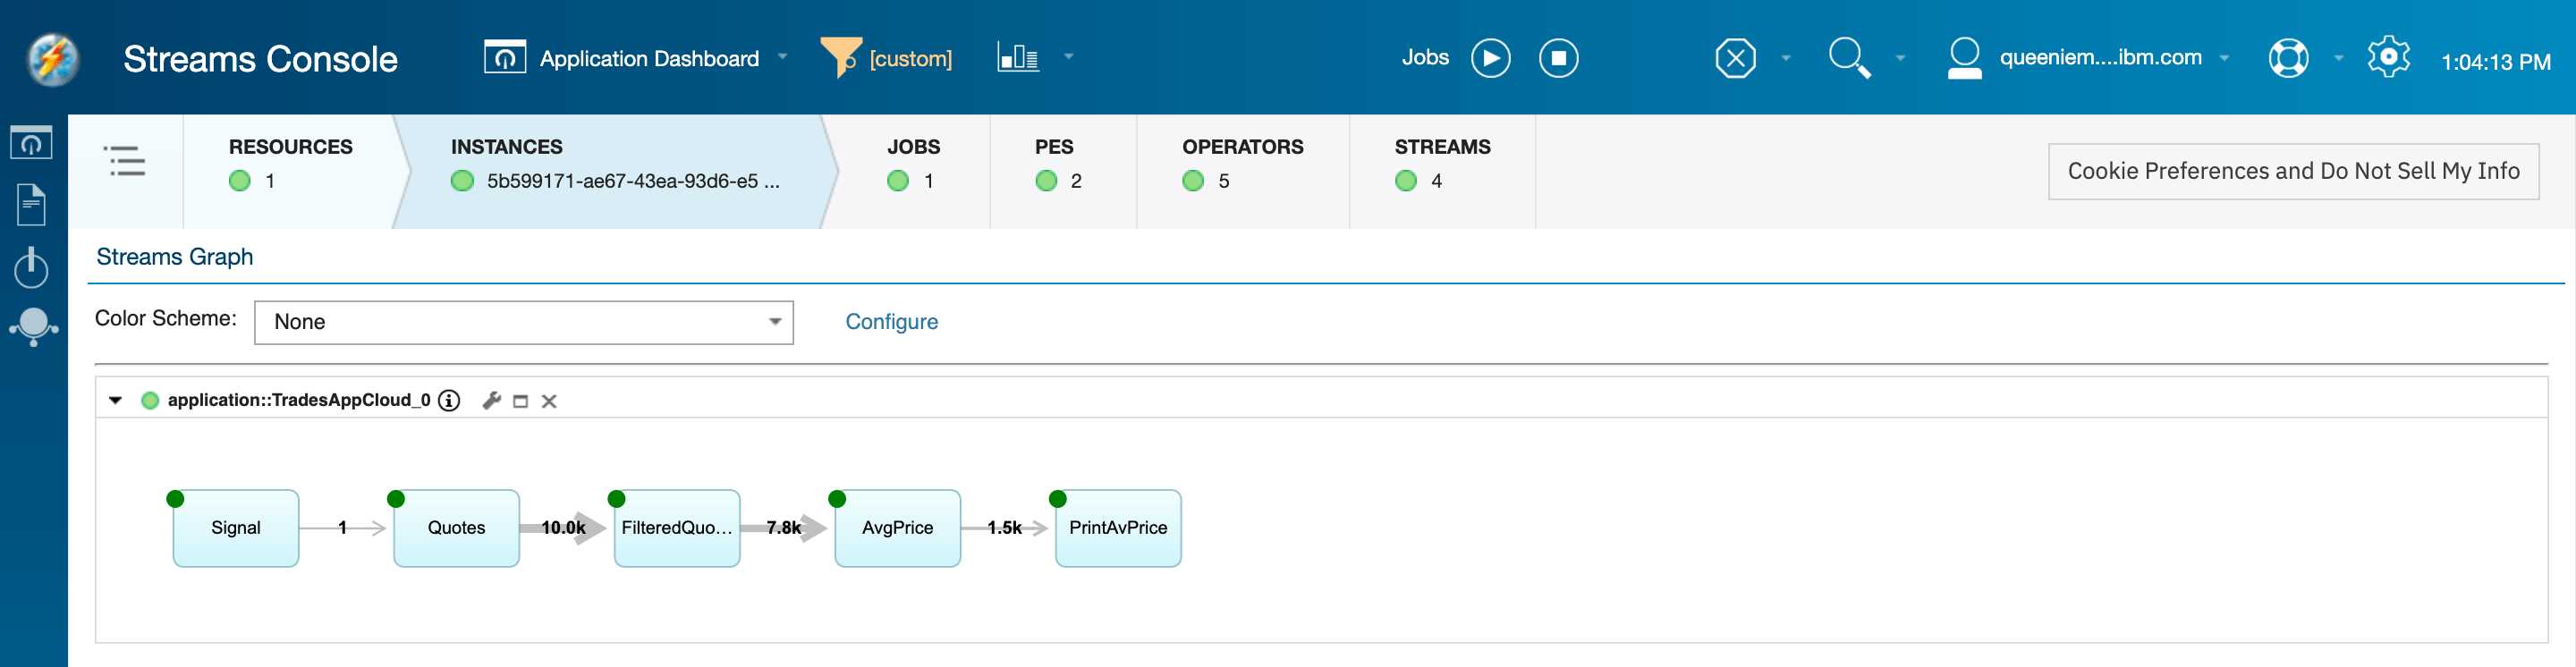
Observe the data flowing through the job in real time
Quotes operator produces a stream of stock quotes. Let’s take a look at the data.
- In the Application Dashboard, find the Streams Graph card and expand it.
- Hover over the stream that comes out of the
Quotesoperator and right-click. - Select Create Dashboard View.
- Accept the default options and click on the OK button.
- Minimize the Streams Graph card.
- A new card is created in the dashboard that displays the tuples in the stream produced by the
Quotesoperator. Notice that the view is processed as new data arrives.
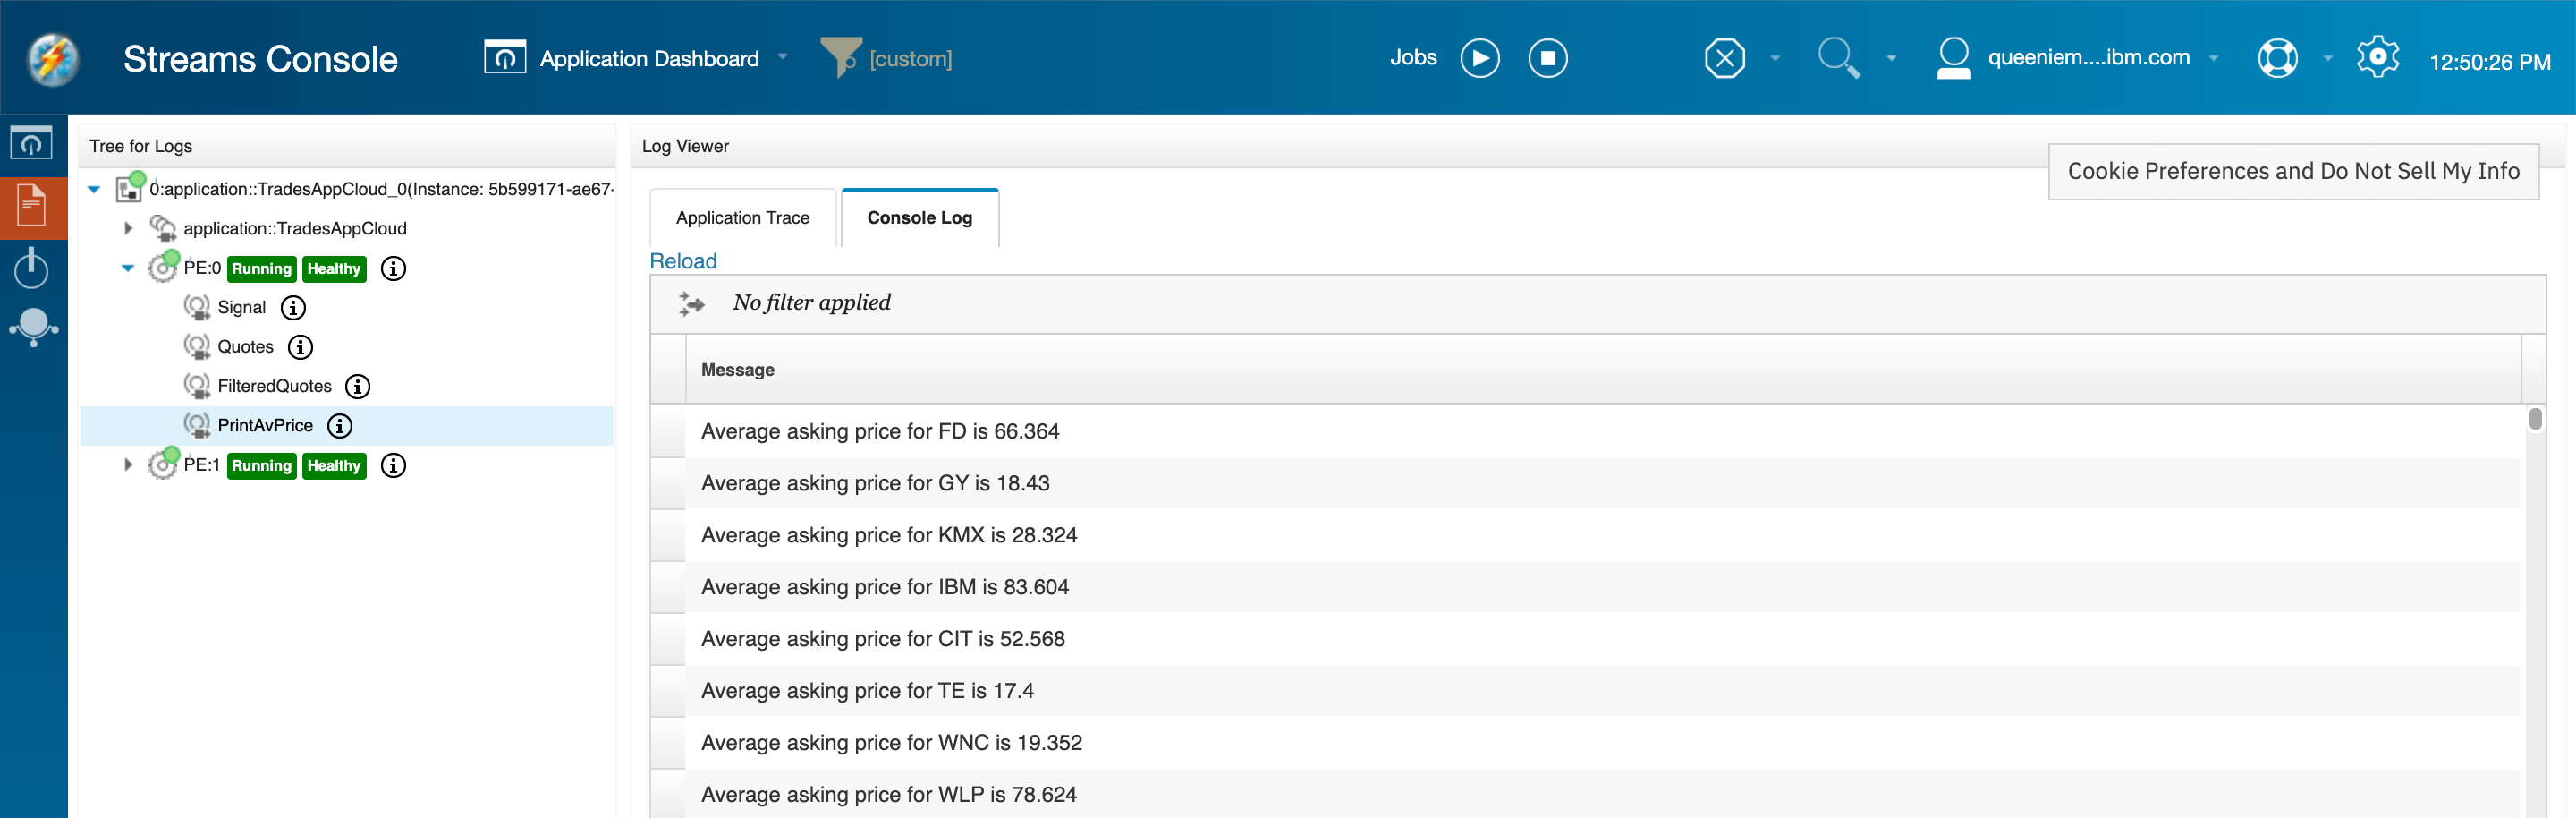
View application logs
All application output, including messages printed to standard out, errors, and trace data are sent to the logs.
- To view logs, click on the Log Viewer icon on the left side.
- Drill down to the object that you want to view the logs for.
- Choose one of the log types and the log data will be displayed.
- If you want to see the latest logs, click Reload.
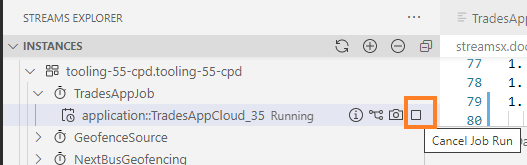
Cancel the job
Bring up the Streams Explorer view. Hover over the job node and then click on the Cancel Job icon that appears on the right.
Summary
In this section, you learned how to:
- Install and set up the IBM Streams extension for VS Code
- Add a Streams instance
- Import an application
- Compile an application
- Run the application
- Monitor the running application using the job graph and Streams Console by viewing the data on a stream and viewing application logs
- Cancel a job
In the next section, you’ll learn how to create the sample application that you’ve been working with.