Monitoring IBM Streams applications with Cloud Pak for Data
Edit meIf you submitted a job to run on an IBM Streams instance in IBM Cloud Pak for Data (CPD), you can monitor and manage the application from the CPD user interface. This page discusses some of the features available and how to use them.
To monitor an application using the Streams extension for VS Code instead, see the documentation
This guide will cover:
Viewing a Streams job in Cloud Pak for Data
To monitor or manage a job, you first need to find the job in the Cloud Pak for Data user interface.
Follow these steps to open the job details in your version of CPD.
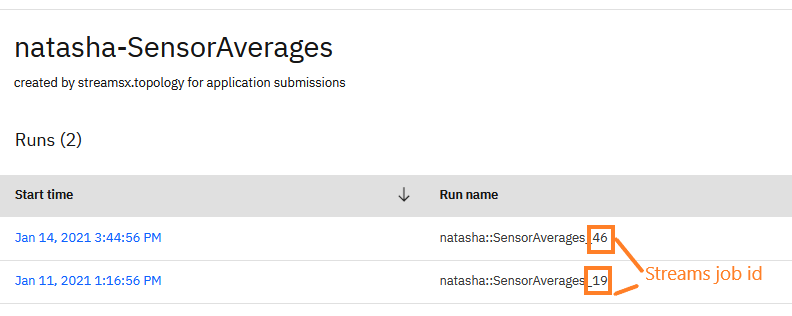
You need the job name and job ID, which are displayed whenever you submit the job from VS Code or Streams Console.
Cloud Pak for Data 2.0-3.0
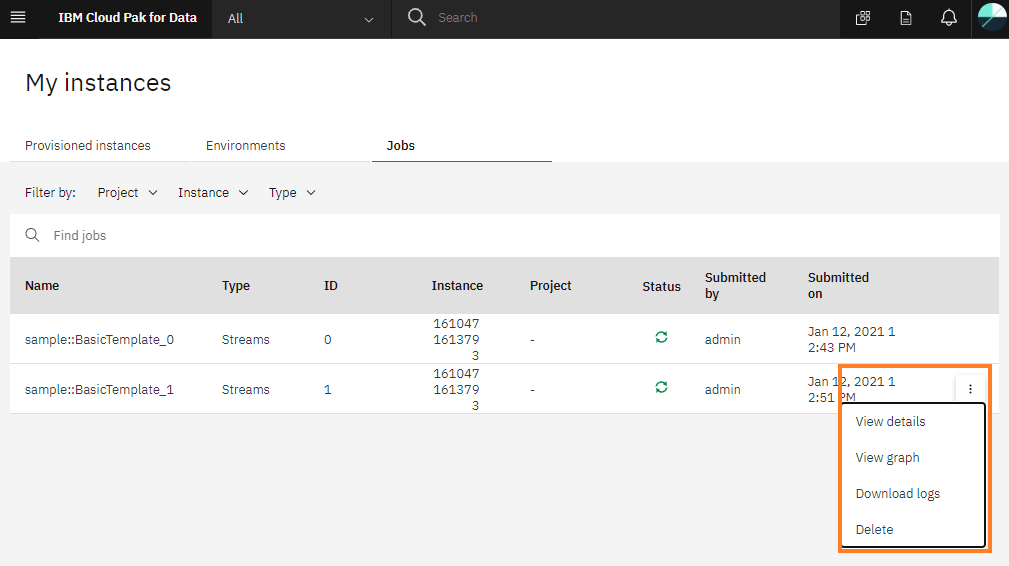
- From the IBM Cloud Pak for Data main menu and click on My instances.
- Click on the Jobs tab.
- Find the job in the list.
To open the Job Graph, click the View graph from the context menu.
To download logs, click Download logs from the context menu.
Cloud Pak for Data 3.5+
A running Streams job corresponds to a job run in Cloud Pak for Data.
1. Open the job details page
To download logs from a Streams job in Cloud Pak for Data (CPD) 3.5+, you must first find the job run in CPD. The steps to find the job run depend on how the job was submitted.
Jobs launched from a notebook in a CPD project:
- Open your project and click on the Jobs tab. This will show a list of the project's jobs.
Find your job based on the
Job Name. This will typically be of the form<namespace>-<topology_name>. This will list all of the job runs.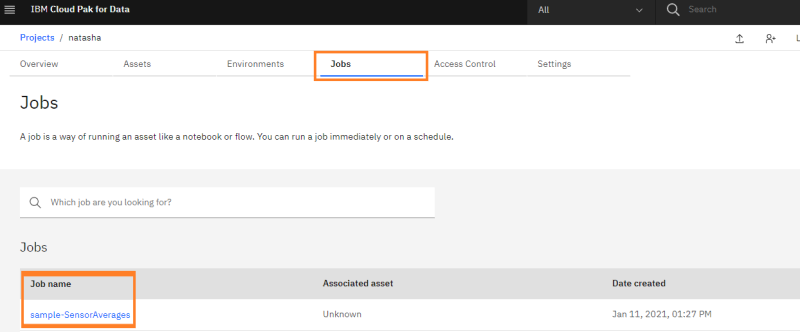
Click the Run name for the job run, which will have the format
<namesapce>::<topology-name>_<job ID>.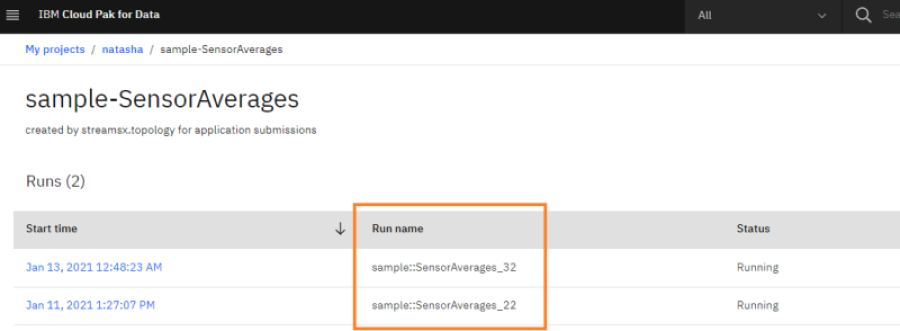
All other scenarios:
- From the CPD main menu, click Deployments.
- In the Activity tab, click on View Active runs. This will take you to a list of job runs.
- In the Views drop down, choose Jobs with active runs.
- Click on the entry in the list matching your job name. If you submitted through the Streams Console. click the
entry whose Type listed as Streams Legacy. Otherwise, click the entry matching the
application name.
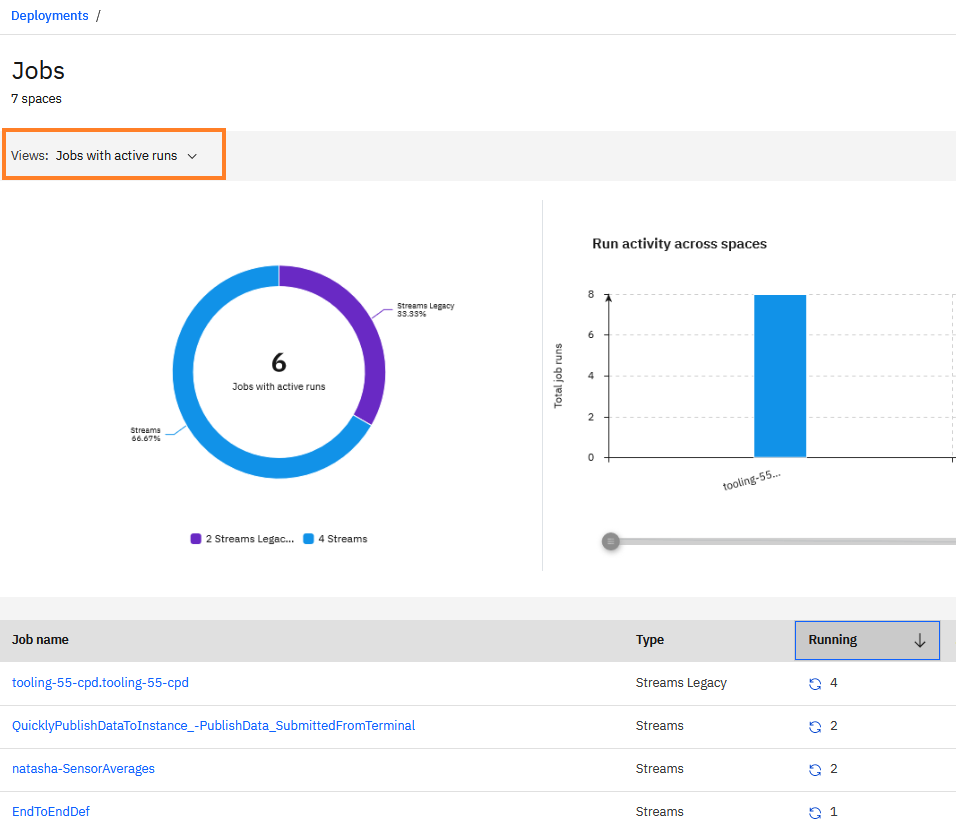
-
From the list of job runs that appears, click the job run based on the job id and start time.
This opens the Job Details page.
2. Job details: logs and the Job Graph
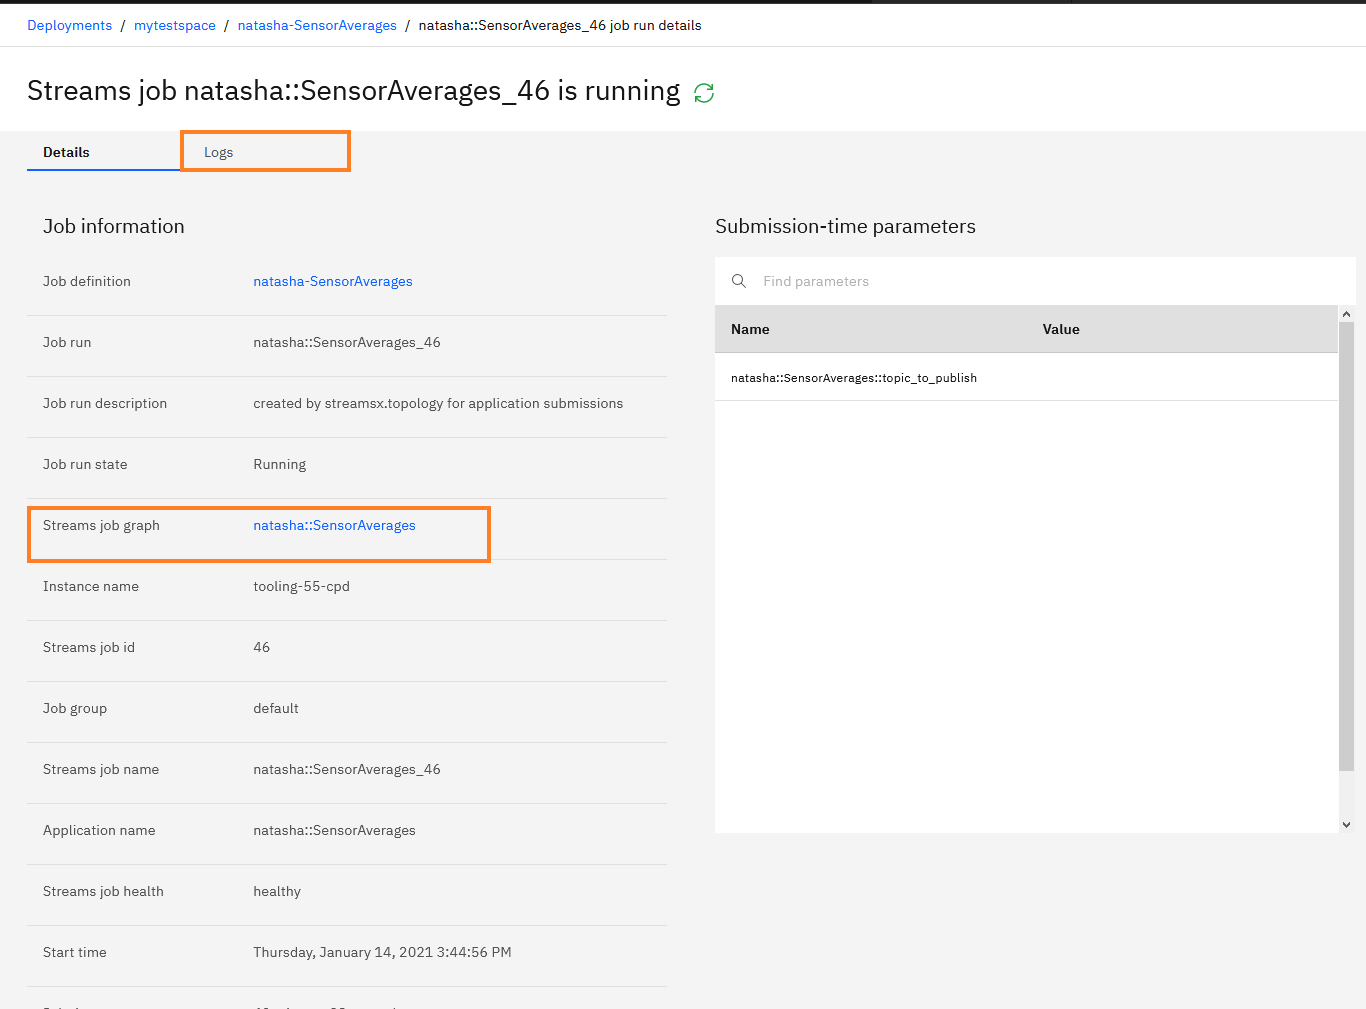
Once you have opened the job details page, you can see job related information and open the job graph.
-
To open the Job Graph, click the Streams job graph link.
-
To download logs, click the Logs tab to create a log snapshot and download it.
Working with the job in the Job Graph
The Job Graph displays the graph of the application and provides tools for monitoring it.
You can also use the Job Graph to:
- View the application graph
- Observe operator health, metrics and congestion
- Download trace information for an individual operator.
- View a sample of the data flowing through your application by examining data in the view panel.
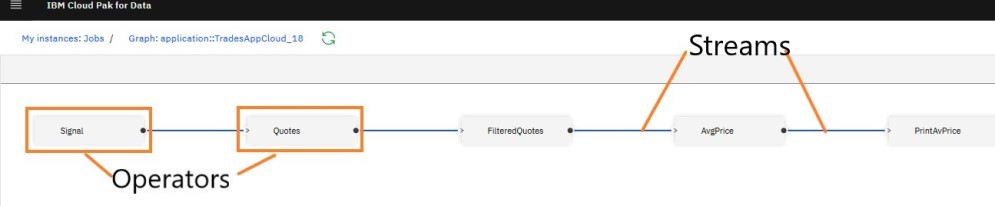
Viewing the application graph
Streams applications are directed graphs that analyze data as it is processed. Each node in the graph is an operator that processes data, and each line between operators is a stream of live data.
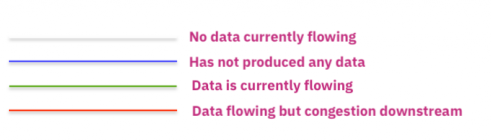
The streams in the graph are color coded to help you easily understand the current status of your application.
Additional Job Graph features
This screencast shows some features of the Job Graph and how to use them.
Watch Operator/Stream metrics
Hover over a stream or an operator to view information about it and its metrics. To pin the metrics so they are always visible, right-click the operator or stream and click Watch.
Downloading logs
Follow the steps described earlier in this page to find the job and then download its logs.
Logs will be downloaded as an archive. Unpack the archive and examine files with name matching <hostname>/<jobs>.
Observe streaming data with Views
A View is a connection to a particular Stream in a running application that allows you to see a sample of the data in the Stream.
Views can be defined in an SPL with the @view annotation, or in Python with the Stream.view function.
Once the application is running, you can use the View to observe the data on the stream. Additionally, Views can also be added at runtime to a job, with some exceptions.
To add a view or inspect the data in a View, you can also use the Streams Console or the Job Graph in IBM Cloud Pak for Data.
Quick facts about views
- Views provide a sample of the data on a Stream, and not all the tuples on the Stream.
- Use a View to fetch data from a Stream only while the application is running.
- The data retrieved by the View is read-only, so you cannot use a View to change the tuples on a Stream.
Displaying an existing View
When the Job Graph opens, any Views already defined in the application are visible in the View Pane.
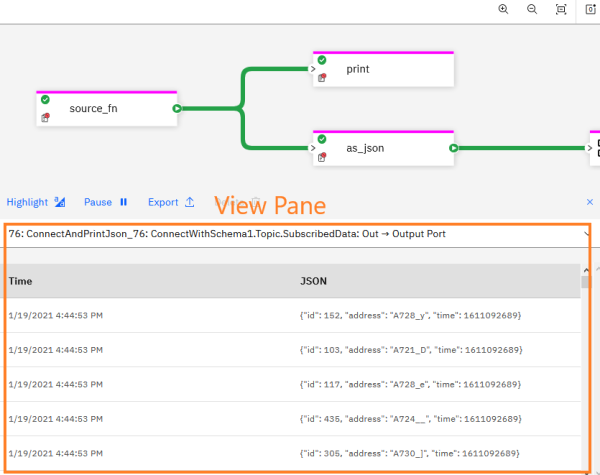
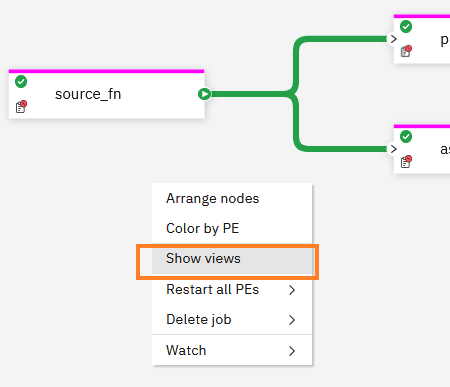
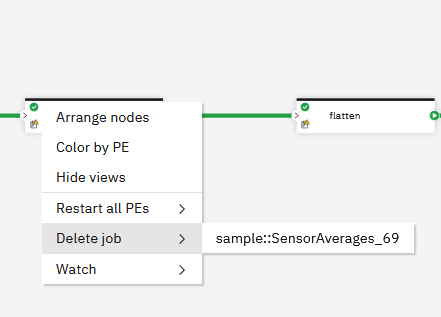
If the View Pane is not visible, right-click anywhere in the canvas and click Show Views.
Choose the view you want to see from the drop-down menu.
Adding a view to a running application
To see the data on any Stream in the Job Graph, you can add a view:
- Right-click on the Stream and select View data > Create new view.
- The new view should appear in the View Pane.
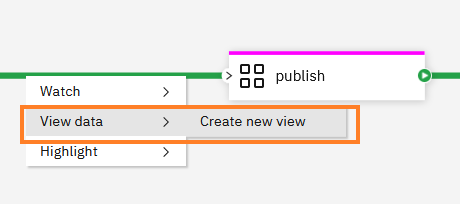
If the View data action is not visible in the menu, the Stream does not support adding a View at runtime.
Cancel a running job
To cancel a running job, select Delete job from the Job Graph.
Summary
This page has a summary of the Job Graph. The Streams Console has more advanced features. See the next section to learn more.