Building and running applications
When you have finished developing an SPL application, you can build and/or submit it to to a Streams instance.
Building and submitting a SPL application
Before you begin
If you plan to build and/or submit your application(s) from a Makefile, you must configure your sc command invocation to pull in toolkit dependencies using -t, --spl-path=path.
| Toolkit type | Toolkit lookup path |
|---|---|
| Streams product toolkits | $(STREAMS_INSTALL)/toolkits |
| Toolkits that were uploaded to the Streams build service (Streams 5.0+ only) | $(STREAMS_BUILDSERVICE_TOOLKITS) |
| Local toolkits included the Toolkit Paths setting | ../toolkits |
Example:
all:
	sc -M yournamespace::YourMainComposite -t $(STREAMS_INSTALL)/toolkits:$(STREAMS_BUILDSERVICE_TOOLKITS):../toolkits
Procedure
- Add a Streams instance to the Streams Explorer in VS Code if you haven’t already.
- Right-click on a
.splorMakefilefile. There are three build options:- Build: Builds and downloads the application bundle(s).
- Build and Submit Job: Builds and submits the application(s) to a Streams instance.
- Build Edge Application Image: Builds a Docker image that can be deployed to edge systems. This requires an IBM Cloud Pak for Data deployment with edge application image builds enabled. For more information, see Building edge applications.
- Follow the prompts to submit the build.
Note: In order to detect your application folder, ensure that it contains either an info.xml or Makefile file. If your SPL application is defined with a namespace, then one of these files must be present in the parent folder; otherwise, one of these files must be present in the same folder as your .spl file.
As an example, consider the following application folder layout:
/+ YourAppDir                   # application folder
   /+ info.xml                  # name, version, dependency information
   /+ yournamespace             # namespace folder
      /+ YourMainComposite.spl  # .spl file with the namespace yournamespace and the main composite YourMainComposite
For more information, refer to the documentation.
Watch and learn: This video demonstrates how to build and submit an application.
Building on OSStreams
- Prerequisites:
- Have a docker registry running
- Follow the steps under Building streams
- Have an SPL application ready to be built with OSStreams. Example
- Setting up:
- Open command palette using command + shift + p and select “Open Settings(UI)”
- In the search bar, type in “Streams”
- Checkmark the “Enable OSStreams Builds” box
- In the “OSStreams Image” setting, enter the string containing DNS and port, namespace and the image (The default is “localhost:5000/$USER/streams-runtime:6.debug”)
- Settings are automatically saved, so the tab can be closed
- Workspace:
- Click on file on VSCode and select “Open”
- Select an SPL Project containing the SPL file you wish to build. ex: open this project
- make sure the workspace you open is not included in the namespace of your file you wish to build. For example, the namespace in here is apps.custommetrics, so set your workspace to be the folder right before apps/custommetrics.
- ex: users/bob/documents/spl-playground
- Building the App:
- In the explorer, right click the spl file you wish to build and select “Build on OSStreams”
- In the IBM Streams output console, updates will be shown with the status of the build, starting with “Building with OSStreams…”
- The console will update once the app has been built, or will show any errors that occurred during the build
- The output folder containing the .sab file will be in the directory of the folder that was mounted
Building on V4.3
- Prerequisites:
- Have QSE running on docker
- Have an SPL application ready to be built
- Setting up:
- Open command palette using command + shift + p and select “Open Settings(UI)”
- in the search bar, type in “Streams”
- Checkmark the “Enable V4.3 Builds” box
- In the “QSE Version” setting, enter the QSE version (ex: 4.3.1.4)
- In the “Shared Workspace” setting, enter the volume that is mounted between your computer and the image (ex: “workspace” and make sure to have the file you wish to build in here)
- In the “V43 Imagename” setting, enter the name of the image (ex: streamsdocker4314)
- Settings are automatically saved, so the tab can be closed
- Workspace:
- Click on file on VSCode and select “Open”
- Select an SPL Project containing the SPL file you wish to build. Make sure this is in your shared workspace folder
- Building the App:
- In the explorer, right click the spl file you wish to build and select “Build on V4.3”
- In the IBM Streams output console, updates will be shown with the status of the build, starting with “Building with V4.3…”
- The console will update once the app has been built, or will show any errors that occurred during the build
- The output folder containing the .sab file will be in the directory of the folder that was mounted
Results
This depends on the build selection you made.
- Build: The application bundle (
.sab) file(s) are downloaded to the application’soutputfolder by default. You may submit application bundle files to run on a Streams instance. - Build and Submit Job: Before the job is submitted to the Streams instance, you are prompted to configure the job submission. You may provide submission-time values and specify a job configuration overlay file.
- Build Edge Application Image: An edge application image is stored in the OpenShift internal registry. For more information, see Building edge applications.
Submitting a SPL application bundle
If you have an application bundle file (.sab), you can submit it to a Streams instance.
Procedure
- Add a Streams instance to the Streams Explorer in VS Code if you haven’t already.
- Right-click on an application bundle (
.sab) file and select Submit Job. - Follow the prompts to configure the job submission and submit the application bundle to the Streams instance. You may provide submission-time values and specify a job configuration overlay file.
Results
If the job was submitted successfully, it will appear in the list of jobs for the Streams instance in the Instances section of the Streams Explorer.
Monitoring a running job
Once an application has been submitted, you may monitor the running job using the job graph and/or the Streams Console.
Job graph
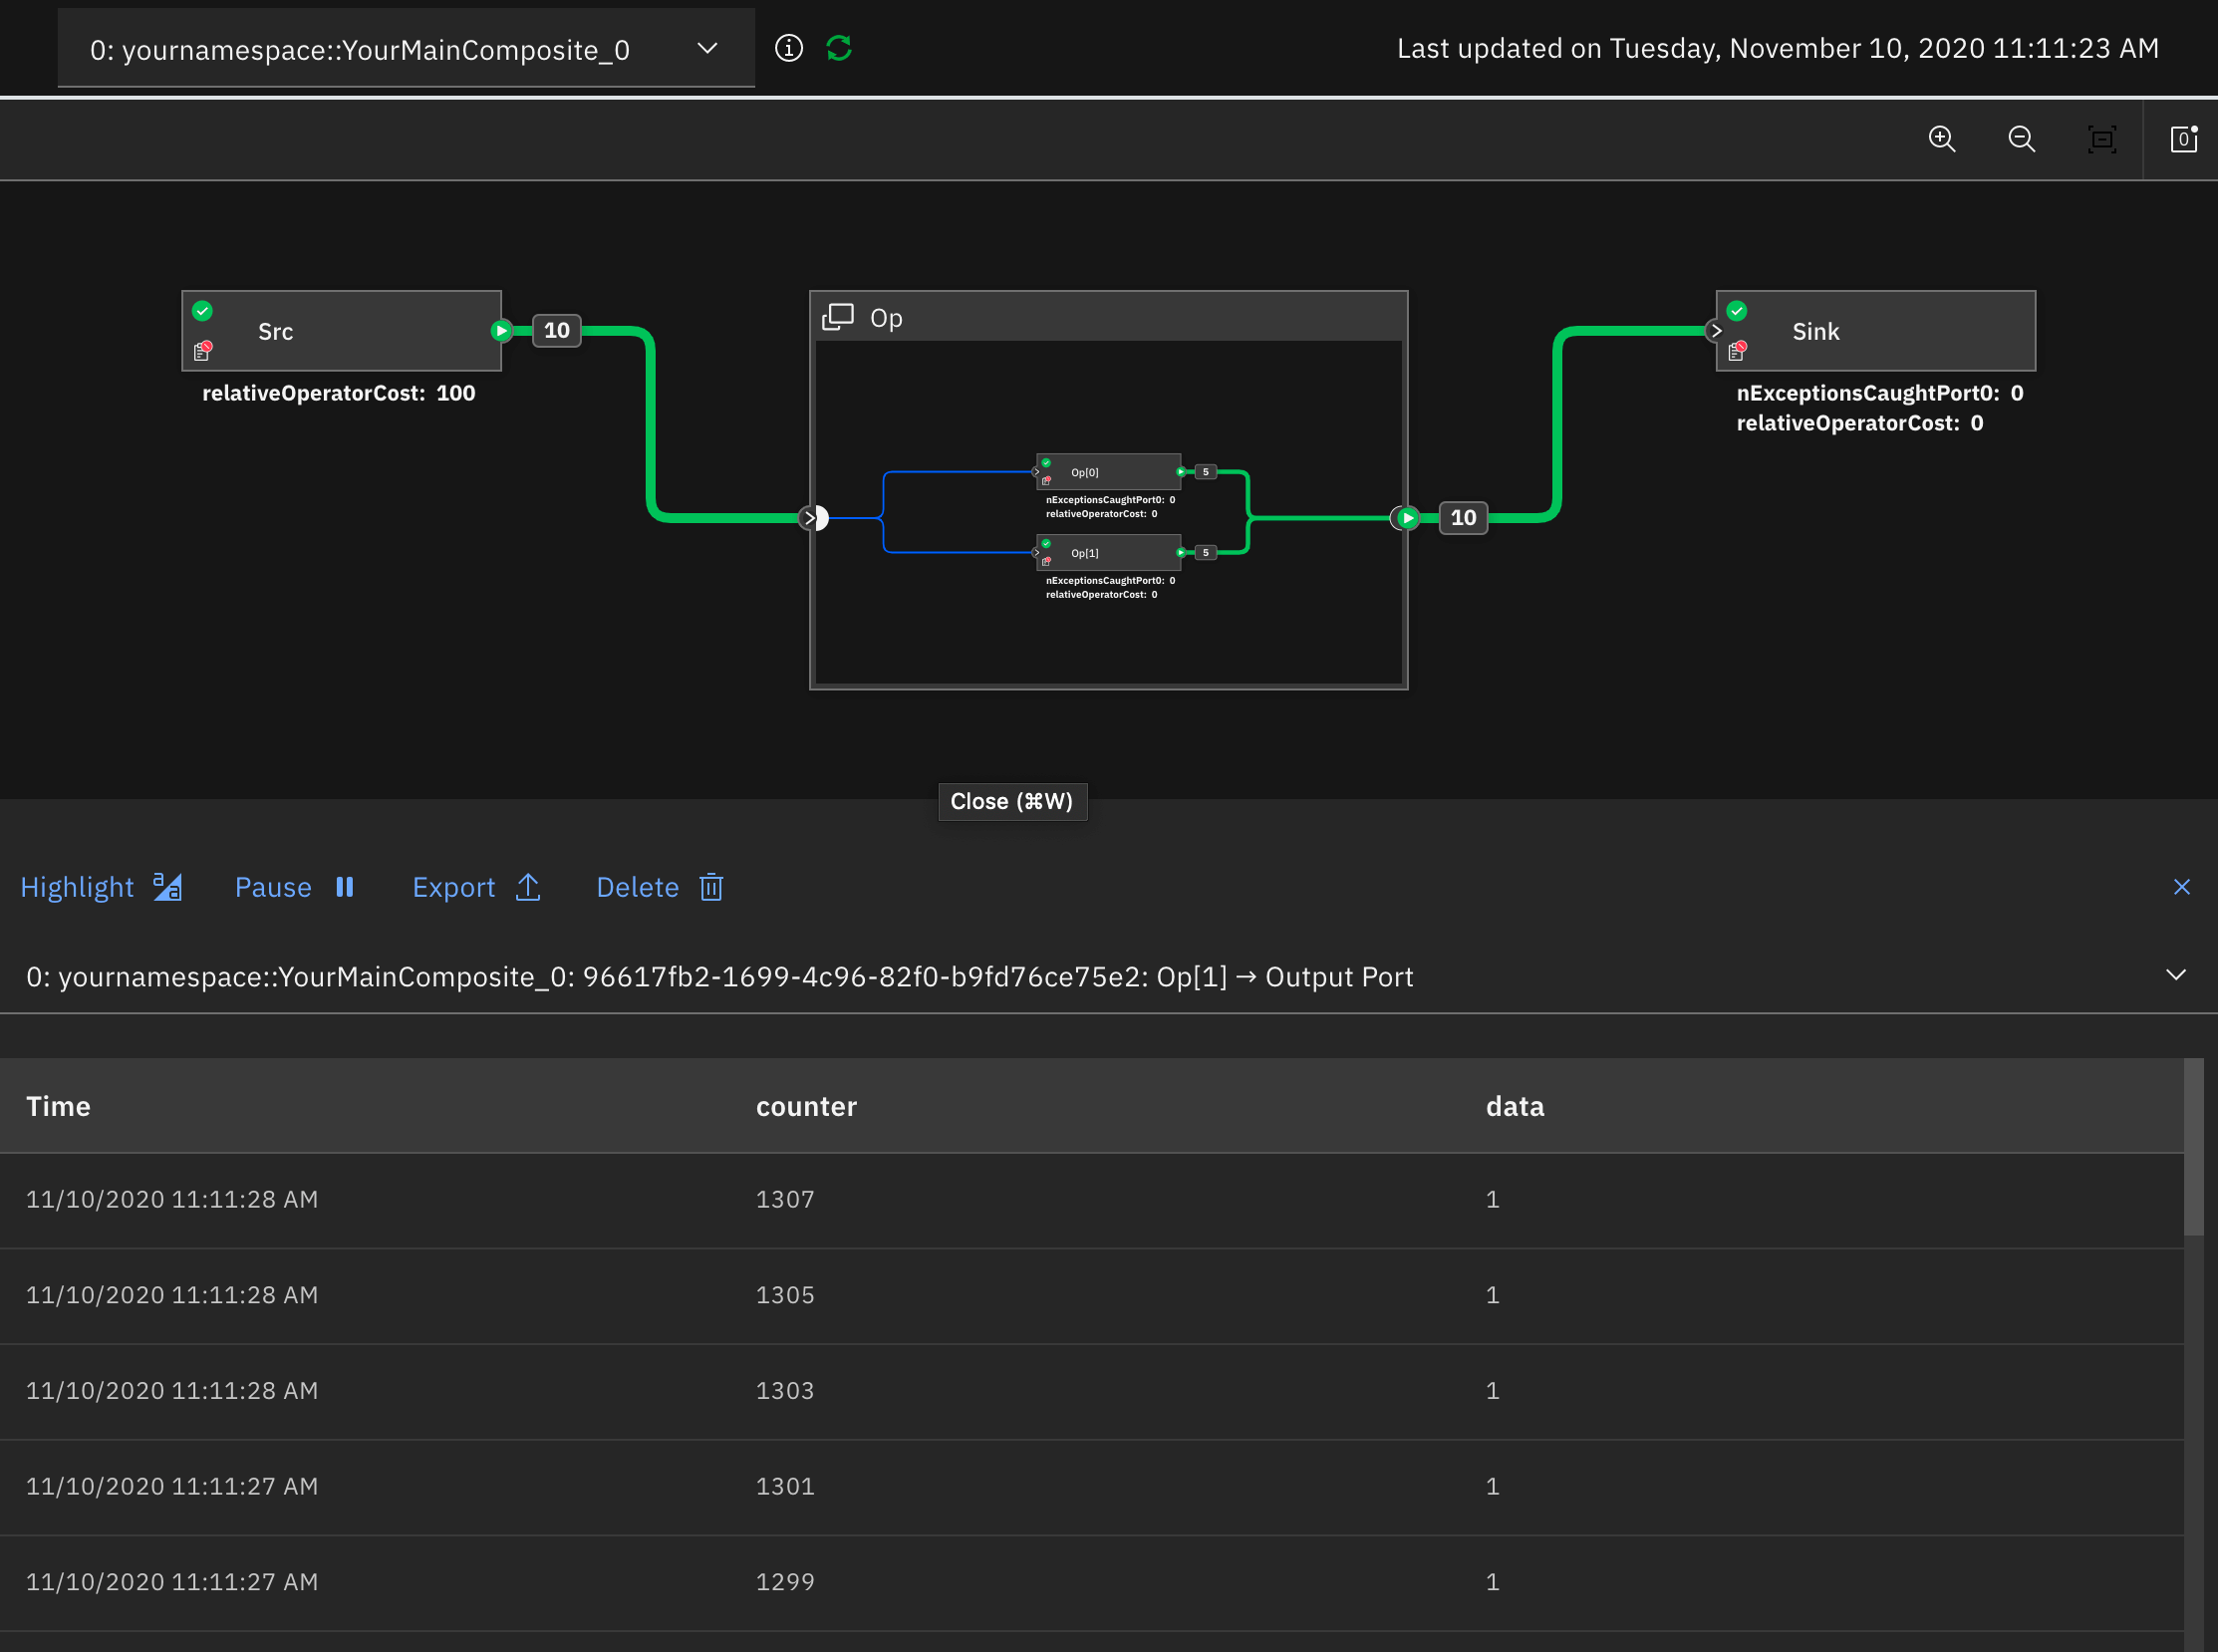
The job graph runs in the VS Code editor. It allows you to easily visualize and monitor your Streams jobs. Streams applications are really directed graphs that analyze data as it is processed. Each node in the graph is an operator that processes data, and each link represents a stream of live data.
Note: You may use the job graph if your job is running in a Streams instance that is an IBM Cloud Pak for Data deployment or IBM Streams standalone deployment.
Some of the useful features include:
- Monitor metrics and flow rates
- View flowing data
- Highlight nodes by branch, upstream, or downstream
- Color nodes by PE
- Set the trace level for a PE
- Download operator trace data
- Restart PE(s)
- Delete job(s)
Launching the job graph
Observe the data flowing through the job in real time
- Hover over a link coming out of an operator node. Right-click and select View data > Create new view.
- A dynamic view is created and a panel appears at the bottom that displays the tuples in the stream produced by the operator. Notice that the view is processed as new data arrives.
View application logs
- To view an operator’s logs, click on the trace icon in the bottom left corner of a node.
-
To view the logs for an entire job, bring up the Streams Explorer. Hover over a job and click on the
Download Job Logs icon
that appears on the right. You will be prompted to select a download location on your machine.

Watch and learn: This video demonstrates the features of the job graph.
Streams Console
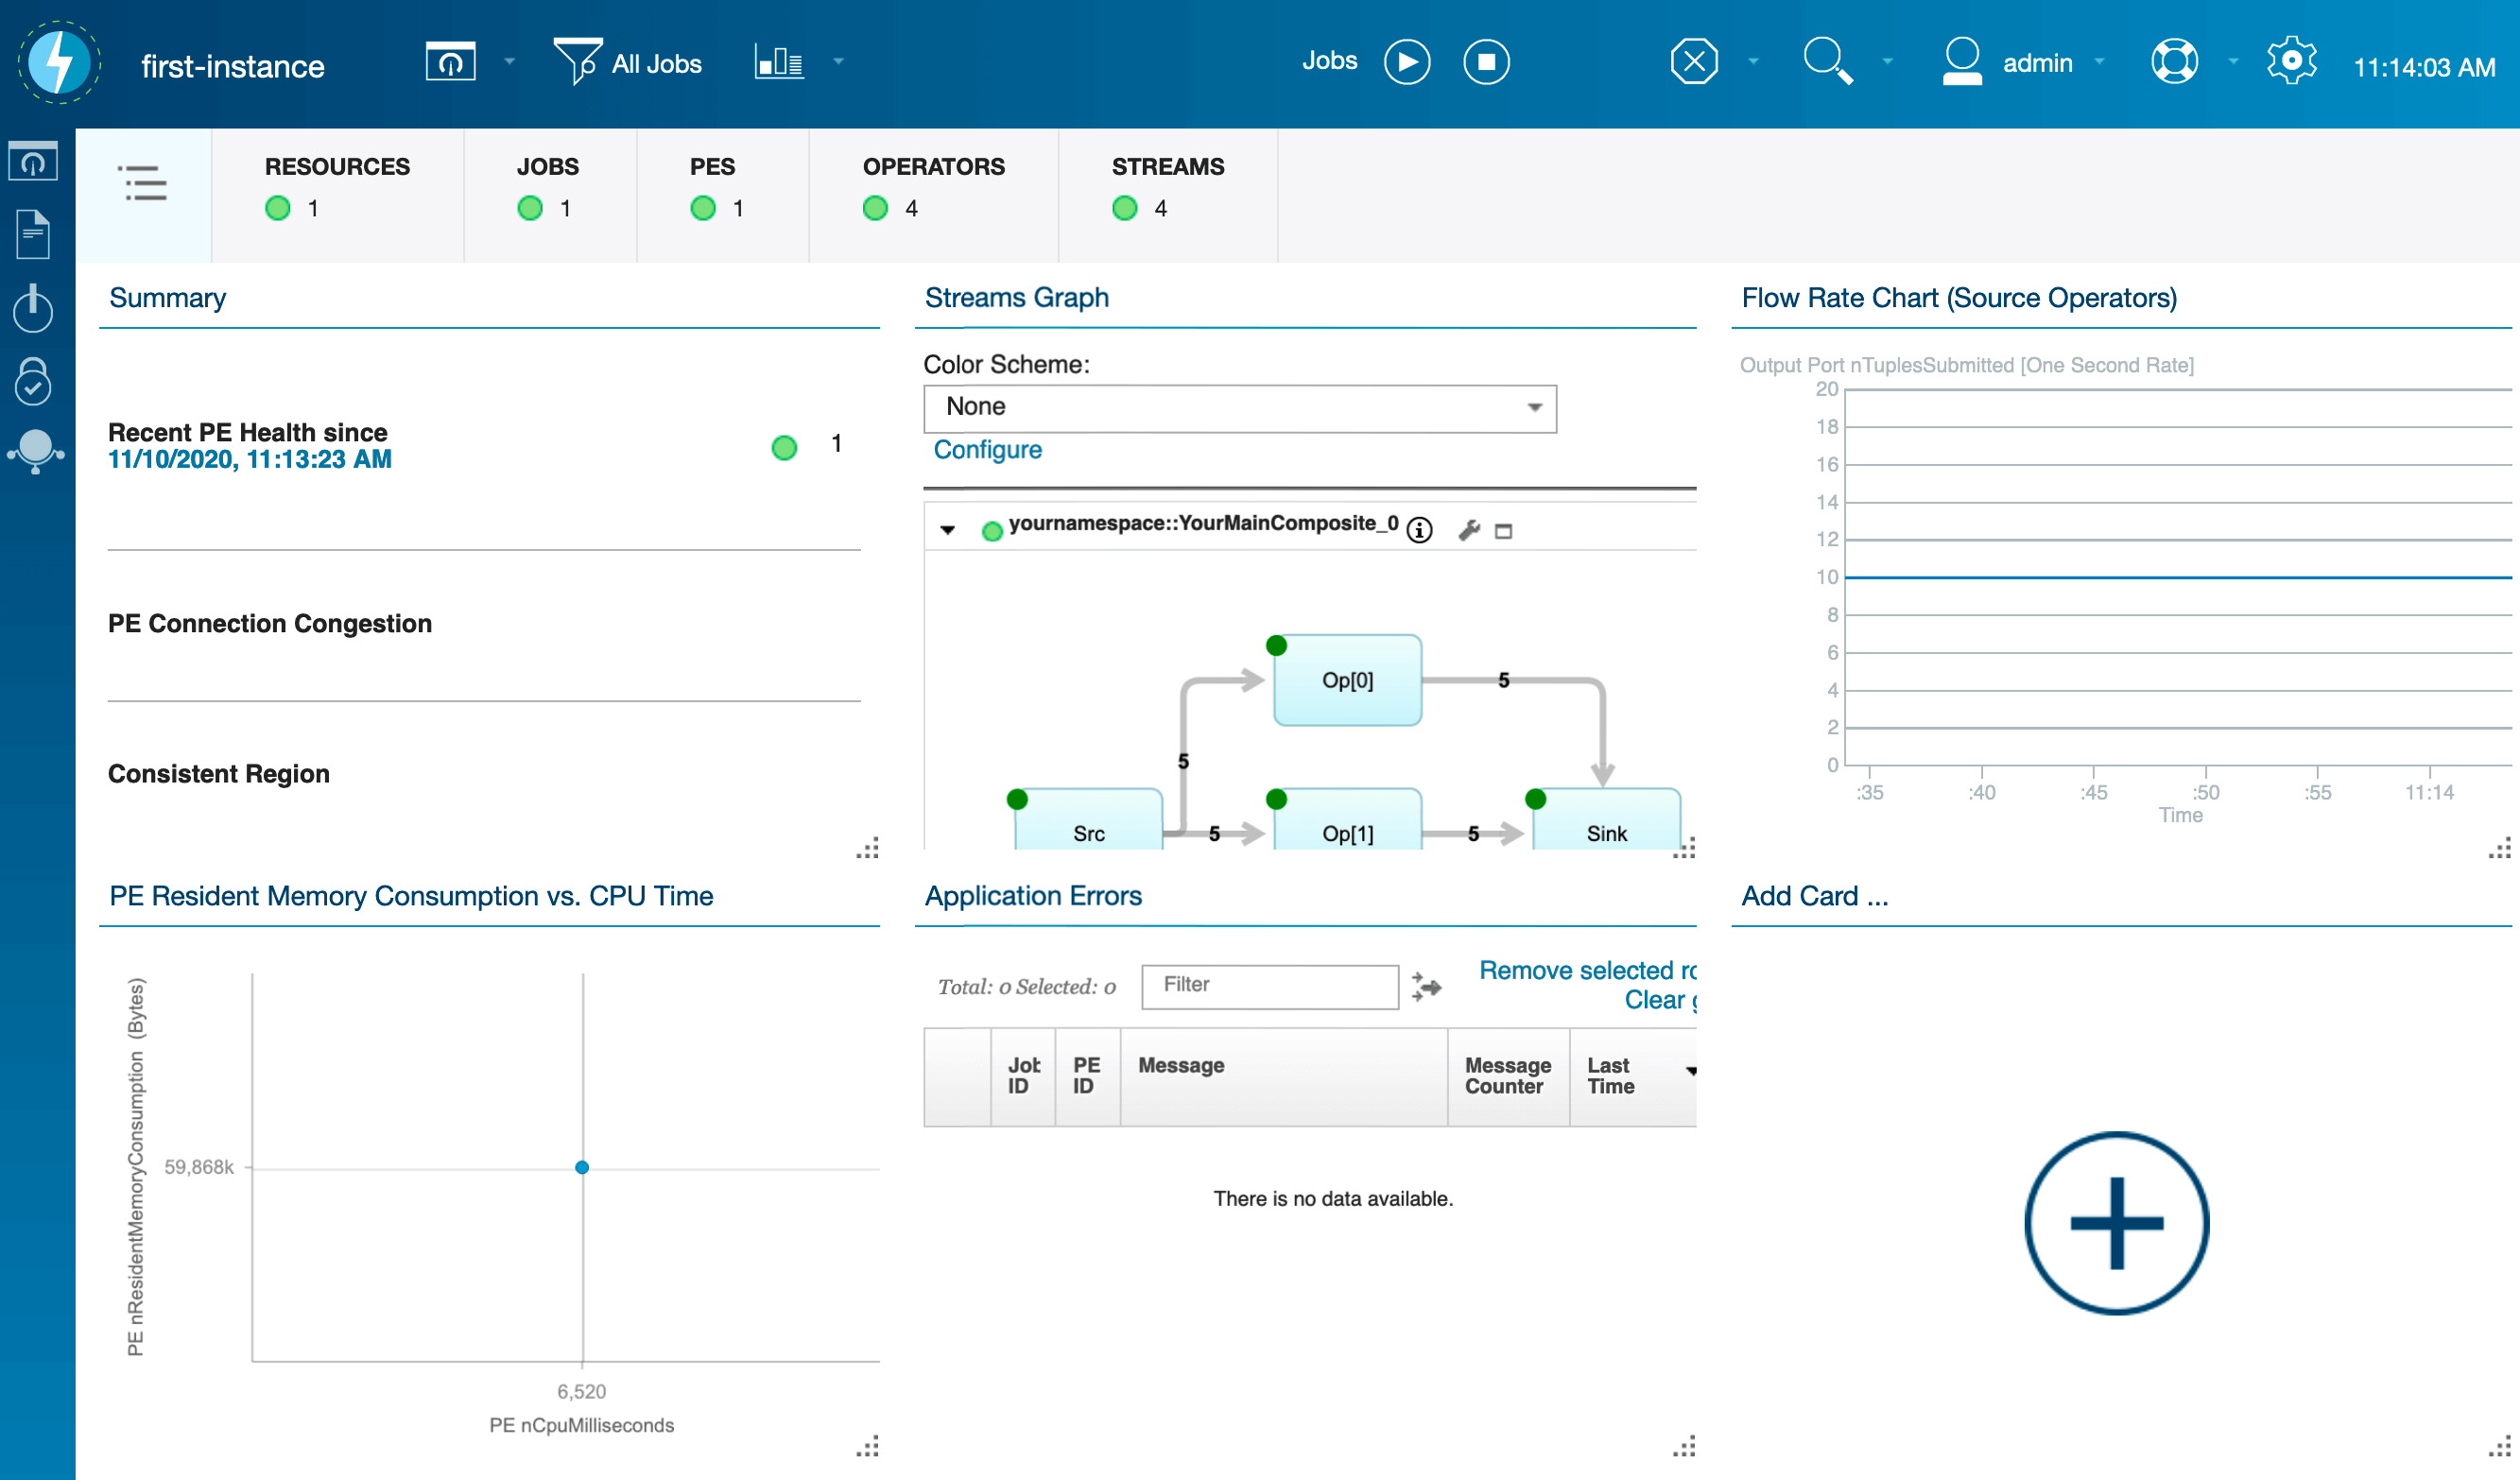
The Streams Console is an integrated console that runs in your web browser. You can use it to manage your instance and resources, configure security, and monitor jobs from a single location. Its sleek and efficient interface also lets you quickly gain insights into the health, metrics, issues, and performance of your Streams instance.
Note: You may use the Streams Console for all Streams instance types unless your job is running in a Streams instance that is an IBM Cloud Pak for Data deployment that does not have the Streams Console enabled.
It has the following capabilities for monitoring your jobs:
- Create queries to focus on data that you care about.
- Display the results of a query in a card. A card lets you visualize important data about your applications with tools, such as live graphs, tables, and charts.
- Create filters to refine the data that is displayed on your dashboards and logs without changing your queries
- View your instance logs based on the environment variables you define.
- Problem determination features to help you quickly find and fix errors in your applications.
- Monitoring how operators behave and guaranteed tuple processing in the cloud. Streams provides metrics to help evaluate the health of Streams services, to aid in diagnosing performance issues, and to analyze throughput of requests.
Launching the Streams Console
Observe the data flowing through the job in real time
- In the Application Dashboard, expand the Streams Graph card and locate your job.
- Hover over a stream coming out of an operator and select Create Dashboard View.
- Configure the view options and click on the OK button.
- Minimize the Streams Graph card.
- A new dashboard card is created that displays the tuples in the stream produced by the operator. Notice that the view is processed as new data arrives.
View application logs
- Click on the Log Viewer icon on the left side.
- Drill down to the object (job, PE, or operator) that you want to view the logs for.
- Choose one of the log types and the log data will be displayed.
- If you want to see the latest logs, click Reload.

Canceling a running job
When you are finished working with an application, you may cancel the job.
Procedure
- Bring up the Streams Explorer and locate the Instances section.
- Hover over a job and click on the Cancel Job icon
that appears on the right.
Results
The processing elements (PEs) for the job are stopped and knowledge of the job and its PEs are removed from the Streams instance. The job is also removed from the Streams Explorer.