Part 2 - Understand the flow of data
Edit meIn this lab, you will further develop the vehicle data filtering application and get a more detailed understanding of the data flow and the facilities in Studio for monitoring and examining the running application. To make this easier, you will make two enhancements that let you see what is happening before the data runs out: you will slow the flow down (left to its own devices, Streams is just too fast) and you'll make it possible to read multiple files. This is a general design pattern for development and debugging.
This video gives an introduction.
Prerequisites
If you successfully completed the previous tutorial, skip to the next step, "Add operators to enhance monitoring."
If you did not successfully complete the previous lab, you can import a Streams project that has been prepared for you and that contains the expected results from Part 1.
To import the Streams project:
- In the Project Explorer, right-click the current project (MyProject), and select Close Project. This gets it out of the way for builds or name conflicts without deleting any files.
- In the top Eclipse menu, click File > Import.
- In the Import dialog, select IBM Streams Studio > SPL Project, then click Next.
- Click Browse.
- In the file browser, expand My Home.
- Scroll down, expand Labs, select IntroLab, and then cick OK.
- Select MyProject1, and click Finish.
This starts a build, but you don't need to wait until it finishes. - In the Project Explorer, expand MyProject1 and then my.name.space.
- Double-click MyMainComposite to open it in the graphical editor.
- In the editor palette, right-click Toolkits.
- In the context menu, clear Show All Toolkits.
Add operators to enhance monitoring
Two new operators are needed to make your application easier to monitor and debug. The Throttle operator copies tuples from input to output at a specified rate rather than as fast as possible. The DirectoryScan operator periodically scans a given directory; for each new file that satisfies optional criteria, it sends out a tuple that contains the file's full path.
Instead of using the palette's filter field to quickly pick up the operators you want, let's browse the full palette to achieve the same result.
- In the graphical editor's palette, expand spl (under Toolkits), and then spl.adapter.
- Drag DirectoryScan into the main composite. The editor names the operator DirectoryScan_4.
- Scroll down in the palette and expand spl.utility.
- Scroll down further, find Throttle.
- Drag and drop it onto the stream Observations, exactly as you
did with the LocationType schema previously. (Make sure the stream
is highlighted by green handles before you let go.)
The operator will be called Throttle_5. The editor automatically connects the Observations stream to its input port and creates a new stream, with the same schema as Observations, from its output port to the input of Filtered. There is no need to adjust the schema of this new stream: The Throttle operator merely controls the rate at which tuples flow, without changing their contents.
To straighten out the graph, click Layout and Fit to Content. - Rename the new stream to
Throttled. Rename the operator to the name of the stream by blanking out its alias. (That's in the General tab of the Properties view; review Part 1 if you forgot how to get there.) - Drag a stream from the output of DirectoryScan_4 to the input of Observations.
- Click Layout > Fit to Content.
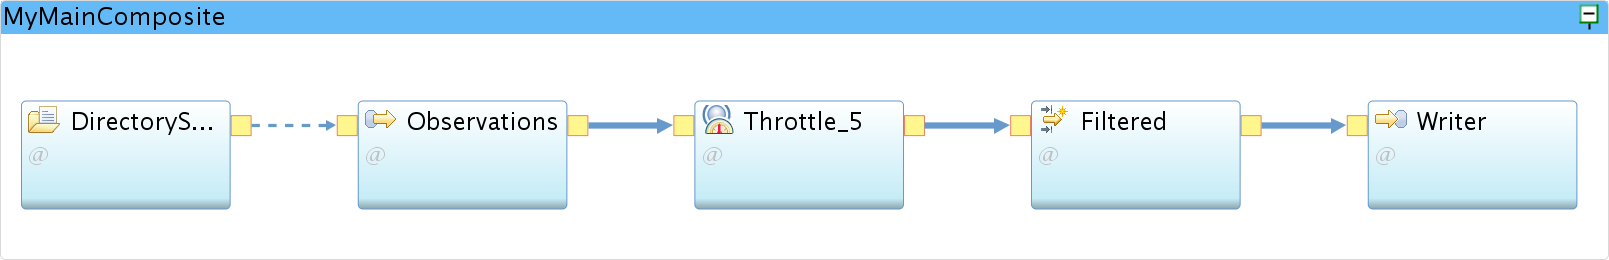
Your graph should look like this at this point:
 Tip for input ports: The FileSource operator can have an input
port, but it is optional. In the original graph you did not use it,
so there is no yellow box on the left. But while dragging a stream
from another operator's output port, the optional input port is
indicated by a lightly outlined, unfilled box, and you can connect
the stream to it like any other port.
Tip for input ports: The FileSource operator can have an input
port, but it is optional. In the original graph you did not use it,
so there is no yellow box on the left. But while dragging a stream
from another operator's output port, the optional input port is
indicated by a lightly outlined, unfilled box, and you can connect
the stream to it like any other port.
Define the new stream and operator details
Now, you need to define the schema for the stream from the DirectoryScan and tell that operator where to look for files. The Observations operator now gets its instructions from an input stream rather than a static parameter, so you have to adjust its configuration. Finally, you need to tell the Throttle the desired flow rate.
The DirectoryScan operator's output port supports only one schema: a single attribute of type rstring, which will hold the full path to the file. You can call that attribute anything you like.
- Select the output stream from DirectoryScan_4 and rename it to
Files. - In the Schema tab in the Properties view, click the first
Name field (placeholder varName) and enter
file. - Press the Tab key to move to the next field (placeholder varType)
and enter
rstring. Remember to use content assist (Ctrl+Space) to reduce typing and avoid errors. Press Enter. - In the editor, select the DirectoryScan_4 operator. In the
Properties view, go to the Param tab and set the directory
parameter to the value
"/home/streamsadmin/data". Remember to include the double quotation marks. - Rename the operator (to
Files) by removing its alias.
A FileSource operator knows which file or files to read either from a static parameter (called file) or from the tuples coming in on an input stream, but not both. Now that you are getting file names from a DirectoryScan operator, that file parameter you used previously is no longer needed. You'll get an error if you keep it. - Select the Observations operator in the editor. In the
Properties view (Param tab), click the file parameter and then
click Remove.
The Throttle operator has a mandatory parameter for specifying the desired flow rate. It is a floating-point number with a unit of tuples per second. - In the editor, select Throttled.
- In the Properties view (Param tab), click the Value field
next to the rate parameter and enter
40.0. The decimal point is necessary to indicate a floating-point value. - Save. There should be no build errors.
Monitor the application by using the instance graph
The Instance Graph in Streams Studio provides many ways to monitor what your application does and how data flows through a running job. This part of the lab explores those capabilities. There is much more to the Instance Graph than this section can cover, so don't hesitate to go beyond these instructions and discover more on your own.
- Launch the application. In the Project Explorer, right-click the main composite (MyMainComposite) and select Launch > Launch Active Build Config To Running Instance. In the Edit Configuration dialog, click Apply if necessary, and then click Launch.
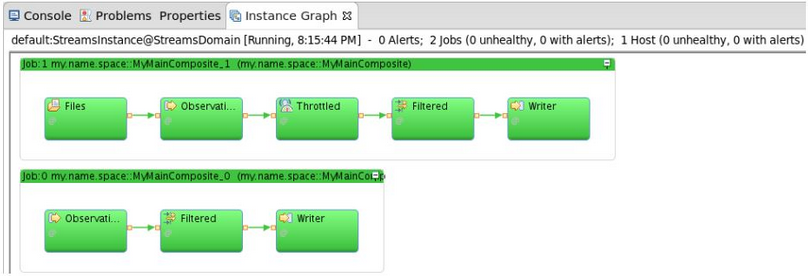
- Maximize the Instance Graph view. You now have two running jobs: the
one you just launched and the one from the previous lab. The old one
is dormant; it's not getting any data. However, leave it running
for now.
To the right of the Instance Graph, a layout options drop-down menu and two selection panes for Layers and Color Schemes allow you to control the display. Explore the various options.
The layout options control how the operators in the graph are grouped:- By Composite
This is the default. You see two boxes representing the two main composites, that is, the two applications and inside each composite, you see the operators that make up the application: three for the old job and five for the new one. - By PE
A PE is a Processing Element, which is like an operating system process. Operators can be combined (fused) into a single PE. This couples them tightly and reduces communication latencies. Operator fusion is a performance optimization topic beyond the scope of this lab. In the preconfigured instance, the default behavior is to fuse all operators running on the same resource. This layout option shows two PEs, one for each job. It looks the same as the By Composite view. - By Resource
Because the virtual machine is only a single resource (host), all operators are shown in the same box representing the resource.
For the rest of this lab, keep the layout set to Composite.
In the Layers box, only the Alert layer is relevant; it should be selected. The other, Consistent Region, is beyond the scope of this lab. (It has to do with guaranteed tuple delivery.) Whether you select it or not has no bearing on this lab. - By Composite
View stream data
While developing an application, you often want to inspect not just the overall tuple flow, but the actual data. Previously, you looked at the results file, but you can also see the data in the Instance Graph. This way, you don't need to add FileSinks whenever you want to capture the output of a particular operator. Let's look at the input to and output from the Filter operator to see whether it's working as expected.
- In the Instance Graph, right-click the stream Throttled (output
of the Throttled operator, input to Filtered). Select Show
Data.
In the Data Visualization settings dialog, verify that the tuple type is what you expect (attributes id, time, latitude, longitude, speed, and heading) and click OK. A Properties view appears. - Repeat the previous step for the stream Filtered between
operators Filtered and Writer. Move and resize both Properties views
so that you can see both tables and the Instance Graph.
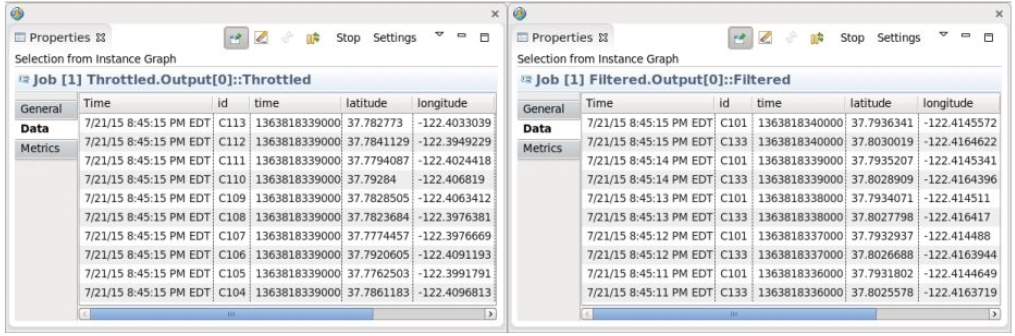
Notice that, as expected, the Filtered stream contains only tuples with an ID value of C101 or C133 whereas the Throttle output contains a greater mix of vehicle IDs:
- When you have seen enough data, dismiss the two floating Properties
views.
In preparation for the next lab, cancel all jobs. - If you used the Filter graph button to hide a job in the Instance Graph, bring it back. Click Filter graph, clear all options, and then click OK.
- Select all jobs in the instance graph by holding down the Ctrl key
and clicking each one. Right-click one of them and click Cancel
job.
The Instance Graph should now be empty.
Summary
You should understand how to develop the vehicle data filtering application, and understand the data flow and the facilities in Studio for monitoring and examining the running application.
You also know how to slow down the flow so that you can more easily view the data.