Reviewing SPL code in Atom
Edit meThis section covers some of the features in Atom that can be used when editing SPL code.
Atom overview
- The Project pane shows the projects that you are currently working on. Use File > Add Project Folder to import a project.
The Command Palette
Open the command palette to see all the available commands.
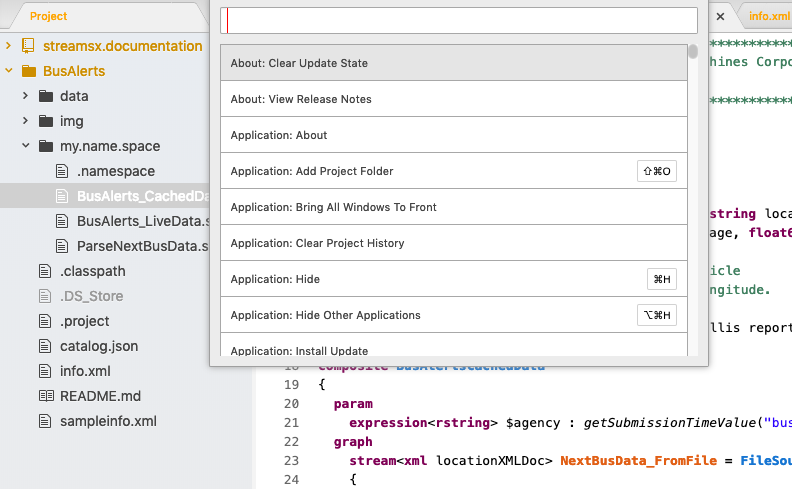
If you looking for a pane, view or an action, search the command palette to find it. For example, you can open the GitHub tab from the command palette, search for Git or GitHub tab and press the Enter key.
Version control with Git
The Git tab manages changes in your local repository and the GitHub tab helps you with projects that are hosted on GitHub.
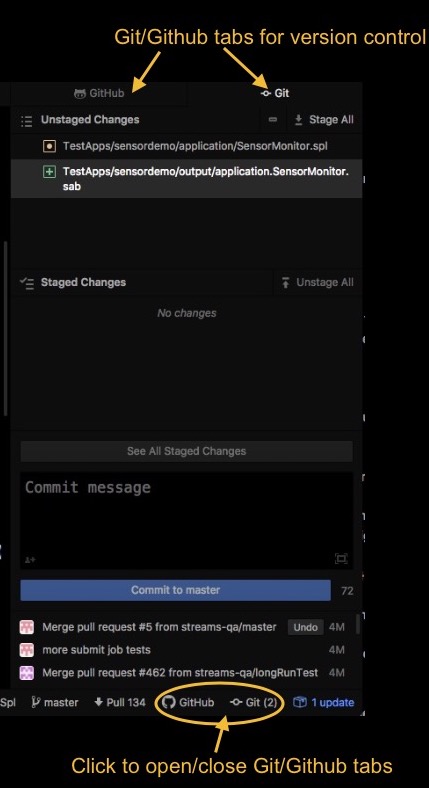
Folders and files that are changed are also highlighted in the Project pane. For example, in the previous screen capture of the Git tab, the SensorMonitor.spl file has been changed (yellow) and the output folder has been added (green).
To learn more about Git support in Atom, see the Atom Flight Manual section on Git.
SPL editing features
The editor has rich code completion and content assist features.
One of Atom’s features is rich code completion and content assist. For example, open my.name.space/BusAlerts_CachedData.spl from the BusAlerts project.
Line 18 contains the line composite BusAlertsCachedData.
This composite is the main composite of this application. It is the application’s entry point.
Use this application to explore some of Atom’s features.
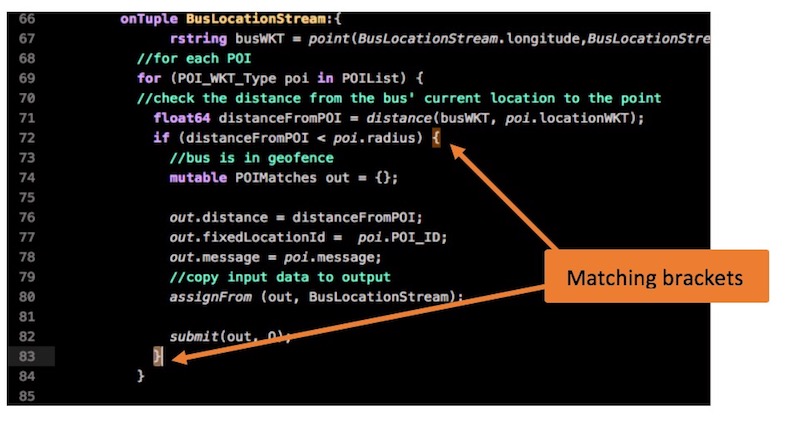
Bracket matching
Bracket matching shows you the scope of a declaration:
Code folding
If the closing bracket isn’t easily visible, collapse portions of code, as shown in the following image:
Anywhere a down arrow ![]() occurs, use it to collapse the code to make it easier to read.
occurs, use it to collapse the code to make it easier to read.
View the documentation for an operator
You can hover over any artifact, such as a parameter, stream, or operator, and its documentation is displayed if it is available.
For example, the first operator in the application is a FileSource operator. Hover over the operator to see its documentation:
This operator reads data from a file and produces a stream of tuples that represents the data that was in the file.
The param clause is a list of named parameters of the operator, such as the file parameter that specifies the name of the file.
Hover over the initDelay parameter to see what it does.
Find references within a file
To find out where a stream or operator is used within a file, you can click on it to highlight occurrences. For example, a stream called NextBusData_FromFile is the output of the preceeding FileSource operator. Click the NextBusData_FromFile stream to highlight occurrences:
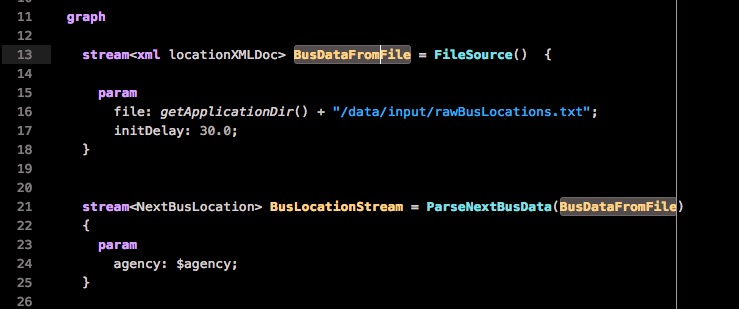
Find references within a project
Use Find References to find where an artifact is used within the whole project.
Continuing the preceding example, the NextBusData_FromFile stream is used by the ParseNextBusData operator. To see where the ParseNextBusData operator is defined, right click and select Find References from the menu.
This action opens the Symbol References pane, which lists all references of this operator, including its definition. Click on a result in that pane to go to the corresponding file.
Note: The Go to Declaration menu item is unsupported due to a limitation in Atom.
Code completion
The editor also supports code completion. As you type, you can press CTRL+SPACE to show a list of suggestions:
The preceding screen capture shows the list of parameters available for the FileSource operator.
Operator Templates
You can also add operators by using templates.
Imagine that instead of the FileSource operator, you want to use the HDFS2FileSource operator to read data from Hadoop.
To add a new HDFS2FileSource operator to your graph, type CTRL + SPACE on an empty line and search the available operator templates for hdfs:
A template exists, so use the down arrows to select HDFS2FileSource for IBM Analytics Engine and hit press the Enter key: The template for the operator is added to the file. Change the operator’s parameters, stream type, and output type to suit your needs.
Finding problems
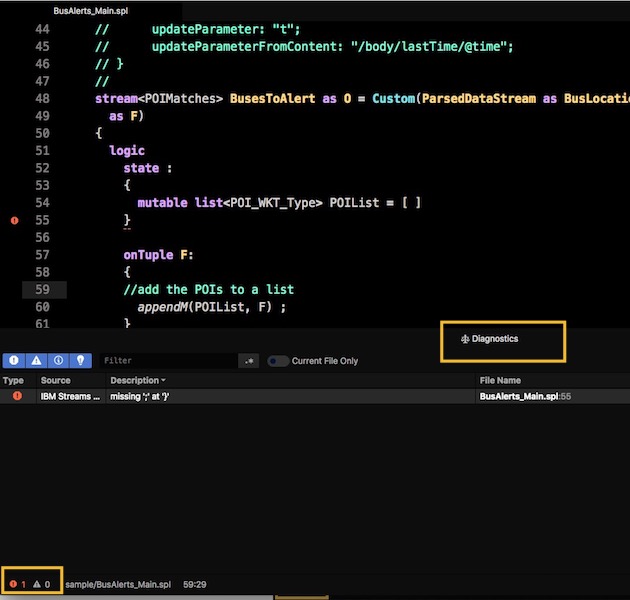
The lower left corner of the editor shows any compilation or syntax errors in your code:
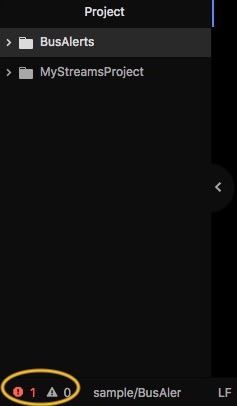
To find and fix the errors, click the error icon to open the Diagnostics pane.
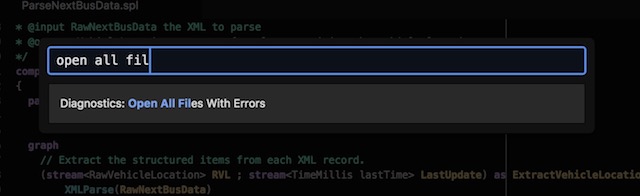
You can also open all files with errors at the same time by typing “diagnostics errors” from the Command Palette:
Summary
- Open the command palette to access all panes and actions in Atom.
CTRL + SPACEshows code completion suggestions at any time.ESCdismisses the suggestions that appear.
Next Steps
Now that you have covered the Atom editor basics, you can run the sample BusAlerts application or continue to the next section to create your own application.
Atom documentation
Additional information about Atom is available in the documentation: