TemperatureSample sample application for IBM Streams Runner for Apache Beam
Edit meYou can use a simple application called TemperatureSample to learn how to submit and monitor an Apache Beam 2.4 application in the Streaming Analytics service on IBM Cloud (formerly IBM Bluemix). The sample application is included with IBM® Streams Runner for Apache Beam. Some familiarity with Beam programming is helpful, though not required; the Apache Beam website has a useful Apache Beam Java SDK Quickstart page and other documentation.
For more information about this sample application, see The TemperatureSample application.
Before you start
Before you run the TemperatureSample sample application, you must configure and run the following service on IBM IBM Cloud®:
- Streaming Analytics. For more information, see Creating a Streaming Analytics service on IBM Cloud.
Important: If you want to compile your application on IBM Cloud, you must unset the STREAMS_INSTALL variable before you submit the application to the Streaming Analytics service.
Running the TemperatureSample application
The following video demonstrates how to launch the TemperatureSample.
-
Navigate to the
$STREAMS_RUNNER_HOME/examplesdirectory. The Streams Runner toolkit provides all necessary files. Assuming that all environment variables are set as described in Downloading and configuring Streams Runner and that the$VCAP_SERVICESIBM Cloud credentials file has credentials in it namedbeam-service, you can launch theTemperatureSampleapplication with the following command:java -cp \ $STREAMS_BEAM_TOOLKIT/lib/com.ibm.streams.beam.translation.jar:\ $STREAMS_RUNNER_HOME/examples/transform/target/beam-examples-transform-<runner-version>.jar \ com.ibm.streams.beam.examples.transform.temperature.TemperatureSample \ --runner=StreamsRunner \ --contextType=STREAMING_ANALYTICS_SERVICE \ --jarsToStage=$STREAMS_RUNNER_HOME/examples/transform/target/beam-examples-transform-x.y.x.jarNote: If the environment variables are not set, you must use full paths, and use the
--vcapServicesparameter to provide the path to the IBM Cloud credentials file.For more information about the parameters available to you, see Pipeline options for Streams Runner.
-
Verify that the application started successfully.
Streams Runner displays information (INFO) messages as it processes the Beam pipeline for your application, turning it into an IBM Streams application bundle (.sab) file, and eventually submitting the .sab file to IBM Cloud:
Sep 27, 2017 2:34:19 PM com.ibm.streams.beam.translation.StreamsRunner run
INFO: Running pipeline using StreamsRunner in context:
     contextType=STREAMING_ANALYTICS_SERVICE
     beamToolkitDir=null
     tracingLevel=null
     jobName=temperaturesample-johnmac-0927183419-7a8ccbfa
StreamsRunner: Sending application to be built remotely, then submitting to Streaming Analytics Service...
StreamsRunner: Application successfully submitted to Streaming Analytic service with Job ID: 1
If you see an exception or error report, it indicates the reason for the failure. The following issues are common:
- A typographical error in the
javacommand or one of the variables it uses. - A problem with the
$VCAP_SERVICESfile or the wrong service name. Check that the"credentials"for"streaming-analytics"in the$VCAP_SERVICESfile match those for your Streaming Analytics service, and that the"name"matches the name that you used for the--serviceNameoption to thejavacommand.
- A typographical error in the
Viewing the running application
After the job is submitted successfully, the application output is displayed while it reports metrics:
----- Temperature Metrics --------------------------------------------------
good.summary: DistributionResult{sum=272674, count=5434, min=0, max=100}
good.device_1: DistributionResult{sum=88417, count=1792, min=0, max=100}
good.device_3: DistributionResult{sum=90876, count=1806, min=0, max=100}
good.device_2: DistributionResult{sum=93381, count=1836, min=0, max=100}
bad.device_1: 365
bad.device_2: 329
bad.device_3: 373
bad.total: 1067
----- System Metrics for step MergeReadings --------------------------------
MetricName{namespace=com.ibm.streams, name=nTuplesProcessed}: 12585
MetricName{namespace=com.ibm.streams, name=nTuplesSubmitted}: 12581
At this point, the application is also visible in the Streams console in IBM Cloud. To launch the Streams Console, navigate to the Manage tab of your Streaming Analytics Service and click Launch.
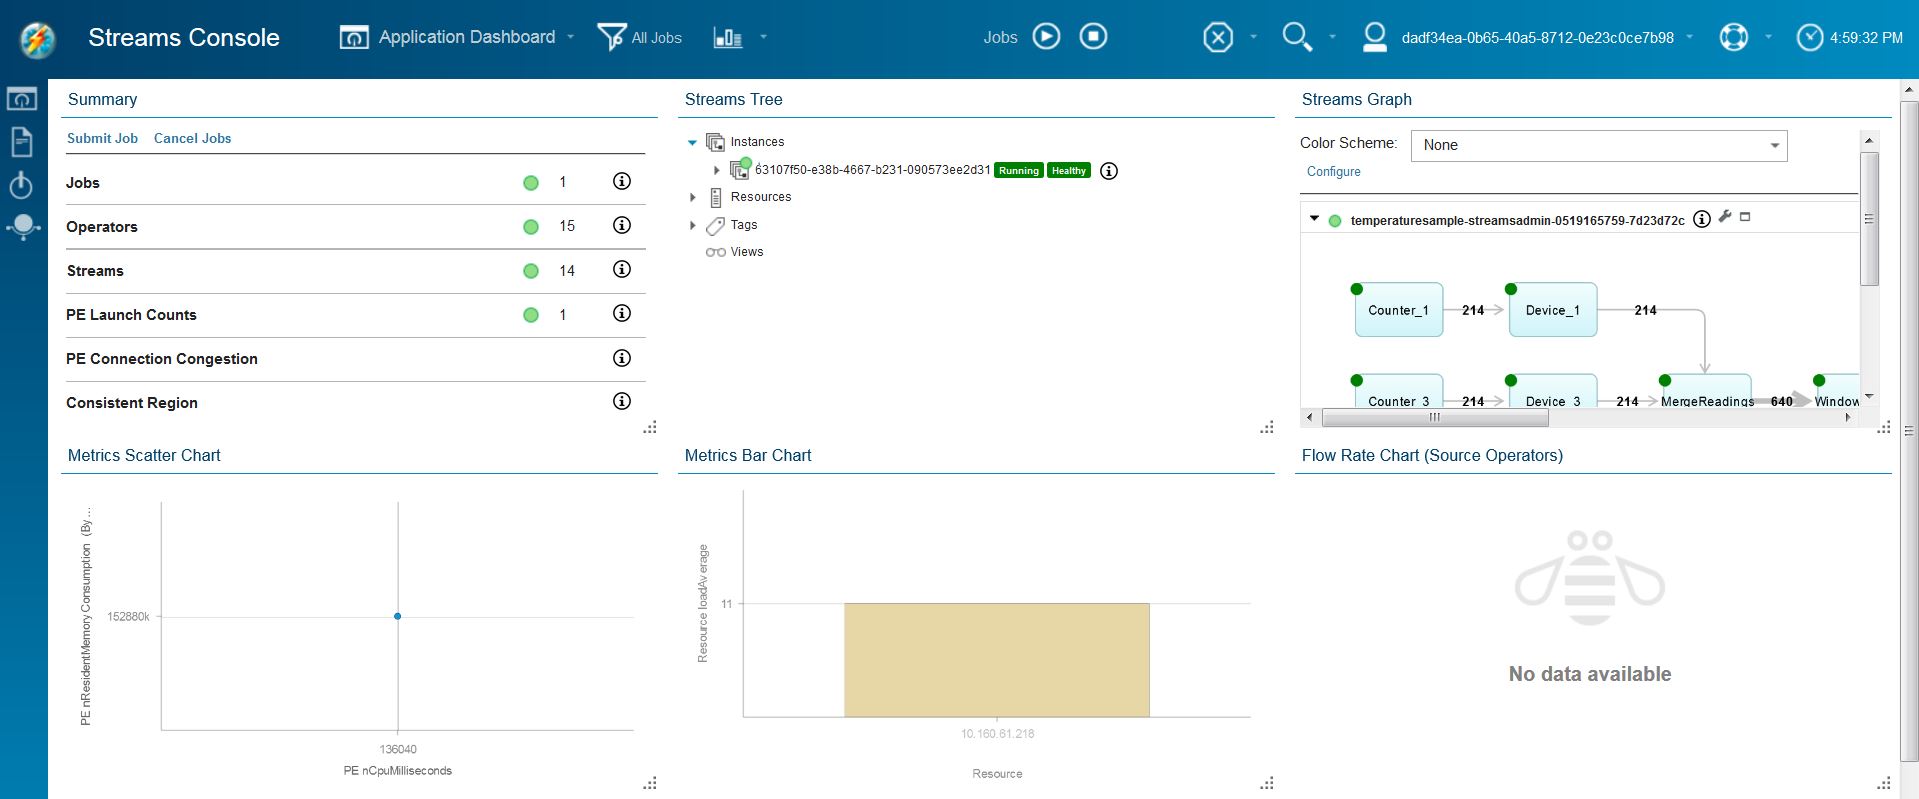
Of particular interest for this application is the Streams Graph. The graph shows how the Streaming Analytics service organizes and executes the code in the sample application. When you maximize the graph, you can see the graph of the whole application:

By default, the graph shows the Beam transforms of the application and matches the pipeline structure that is described in the overview. The names that are used in the graph are the same as those used in the application unless there are transform names that are not unique.
Although this simplified view matches Beam, it omits details about how Streams is executing the application. To see those details, click Configure (the wrench icon), select Show raw graph, and click Apply.
Now the application is shown with the Streams operators instead of the Beam transforms. It is still similar in structure, and the names are similar to the Beam names but not always identical. In some cases, the Streams operator name contains extra information that comes from the names of the Beam Java™ SDK classes that implement the transforms. Also, Streams does not allow all the same characters in operator names that Beam allows in transform names, so characters might be removed or replaced with valid Streams characters.
You can use the Beam metrics API to insert information to monitor your application. For more information, see Monitoring IBM Streams Runner for Apache Beam.
Stopping the application
After you explore the Streams console, stop the application by canceling the job. You can cancel the job in several ways, from almost any place that shows the job in the console, but the simplest way is by clicking Cancel Jobs in the navigation bar. Clicking Cancel Jobs opens a window that shows running jobs. Select the job or jobs that you want to cancel, in this case the job that is running the sample, and click Cancel Jobs.

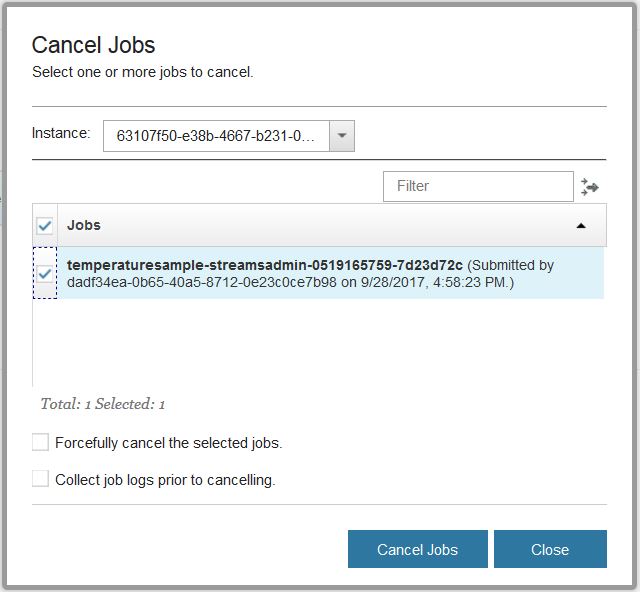
Important: Interrupting or killing the java command in the terminal where you started the application does not cause the job to be stopped, even though the job does stop reporting metrics.
The TemperatureSample application
The TemperatureSample application takes temperature readings from multiple devices. The application splits the readings into “good” (valid) and “bad” (invalid) readings based on a specific threshold. It counts the bad readings and generates some basic statistics for the good readings, and finally logs the results. The full source is available in the $STREAMS_RUNNER_HOME/examples/transform/src/com/ibm/streams/beam/examples/transform/temperature directory, but excerpts are included here to describe the structure of the pipeline.
The devices are artificial; they use the Beam CountingInput transforms named Counter_n to drive another transform named Device_n to generate random readings:
PCollectionList<KV<String,Double>> deviceReadings = PCollectionList.empty(pipeline);

for (int deviceId = 1; deviceId <= options.getNumDevices(); ++deviceId) {
    PCollection<KV<String,Double>> readings = pipeline
            .apply("Counter_" + deviceId, CountingInput.unbounded()
                    .withRate(options.getRate(), Duration.standardSeconds(1)))
            .apply("Device_" + deviceId, MapElements.via(new GenReadingFn(deviceId, maxTemp)));
    deviceReadings = deviceReadings.and(readings);
}
These readings act as inputs to a MergeReadings transform. The transform merges readings from the different devices into a single stream of data that consists of pairs of {deviceName,temperatureReading}, which are then assigned to windows of fixed time duration:
PCollection<KV<String,Double>> mergedReadings = deviceReadings
        .apply("MergeReadings", Flatten.<KV<String,Double>>pCollections())
        .apply("WindowReadings",
                Window.<KV<String,Double>>into(
                        FixedWindows.of(Duration.standardSeconds(options.getWindowSize()))));
The windowed data is validated with a ValidateReadings transform that produces two output streams, one of good readings and one of bad readings:
final TupleTag<KV<String,Double>> goodTag = new TupleTag<KV<String,Double>>(){ ... }
final TupleTag<KV<String,Double>> badTag = new TupleTag<KV<String,Double>>(){ ... }
final double badTempThreshold = options.getBadTempThreshold();

PCollectionTuple validatedReadings = mergedReadings.apply("ValidateReadings",
        ParDo.of(new DoFn<KV<String,Double>,KV<String,Double>>() {
            private static final long serialVersionUID = 1L;

            @ProcessElement
            public void processElement(ProcessContext c) {
                String device = c.element().getKey();
                Double temp = c.element().getValue();
                if (temp < badTempThreshold) {
                    // Good reading, output and update distribution metrics
                    c.output(c.element());
                    ...
                } else {
                    // Bad reading, output to side output, update counters
                    c.output(badTag, c.element());
                    ...
                }
            }
        }).withOutputTags(goodTag, TupleTagList.of(badTag)));
On the good readings, statistics are calculated in a GoodStats transform and then logged by a GoodLog transform:
validatedReadings
        .get(goodTag)
        .apply("GoodStats", Combine.<String, Double, Stats>perKey(new DeviceStatsFn()))
        .apply("GoodLog", ParDo.of(new LogWindowFn<Stats>("Temperature device statistics")));
The bad readings are counted by a BadCount transform and logged by the BadLog transform:
validatedReadings
        .get(badTag)
        .apply("BadCount", Count.<String,Double>perKey())
        .apply("BadLog", ParDo.of(new LogWindowFn<Long>("Temperature device error count")));
The structure of the application becomes clear after it is displayed in the Streams console after the application is run.