Monitoring IBM Streams Runner for Apache Beam
Edit meYou can use the Apache Beam 2.4 metrics API to insert information to monitor your IBM® Streams Runner for Apache Beam application. You can the TemperatureSample application that is included in IBM Streams Runner for Apache Beam to learn how Streams Runner makes metrics available for monitoring, both to the application itself and other monitoring tools.
Adding metrics to your application
Beam supports three basic types of metrics:
- A Counter metric reports a single long value and can be incremented or decremented.
- A Distribution metric holds information about the distribution of reported long values.
- A Gauge metric holds a long value that can be set and a time stamp of the last change.
Steps in the Beam application’s processing pipeline can create and update metrics that are associated with that step. To do so, during processing the application calls Metrics.counter(), Metrics.distribution(), or Metrics.gauge() to get a named metric and then update it.
For example, in the TemperatureSample.main() method, in the processing for the ValidateReadings operation, the code updates two distribution metrics when a value is valid or two counters when a value is not valid:
if (temp < badTempThreshold) {
    // Good reading, output and update distribution metrics
    c.output(c.element());
    long roundedTemp = Math.round(temp);
    Metrics.distribution(COLLECTED_METRIC_NAMESPACE, "good.summary")
            .update(roundedTemp);
    Metrics.distribution(COLLECTED_METRIC_NAMESPACE, "good." + device)
            .update(roundedTemp);
} else {
    // Bad reading, output to side output, update counters
    c.sideOutput(badTag, c.element());
    Metrics.counter(COLLECTED_METRIC_NAMESPACE, "bad.total").inc();
    Metrics.counter(COLLECTED_METRIC_NAMESPACE, "bad." + device).inc();
}
Metrics that are created this way have names that have two parts: a namespace, and a name. In the example, the namespace is always the string COLLECTED_METRIC_NAMESPACE ("TemperatureSample"), but a Java™ class can also be used as a namespace.
The values of the metrics are update-only in the Beam PTransform classes. The current value of a metric can be retrieved only by querying the PipelineResult after you submit the pipeline.
Querying metrics in the application
In a Beam application, the Pipeline.run() method that starts the application pipeline returns a PipelineResult object, and the application can then call PipelineResult.metrics() to get a MetricsResults object if metrics are supported. The application can then use MetricsResult.queryMetrics() to query metrics that match a MetricsFilter object.
The TemperatureSample application periodically queries and prints metrics that the application created and updated:
PipelineResult result = pipeline.run();
...
    MetricResults metrics = result.metrics();
    MetricsFilter collectedFilter = MetricsFilter.builder()
      .addNameFilter(MetricNameFilter.inNamespace(COLLECTED_METRIC_NAMESPACE))
      .build();
    ...
        MetricQueryResults metricResults = metrics.queryMetrics(collectedFilter);
The counters and distributions from COLLECTED_METRIC_NAMESPACE are returned in response to this query.
The Streams Runner application can query metrics only while the application is running, not after it is completed, and can query only attempted() results, not committed() results. It also can return metrics that were not added by the application directly but come from the Streams runtime. These metrics are in a namespace that starts with com.ibm.streams and includes operator metrics such as nTuplesSubmitted and nTuplesProcessed.
Streams Runner uses the name of the Streams operator that implements the step as the step name. This name is usually the same as the name provided when the Beam pipeline is constructed, but might be modified slightly. For example, extra characters that are not allowed in Streams operator names might be removed, or the name might be changed slightly to make it unique. You can see the operator name in the Streams console.
Viewing metrics in the Streams console and other tools
The following video demonstrates how to view metrics using the Streams console.
Streams Runner exposes Beam metrics as Streams metrics, so they are visible to Streams tools such as the console, the REST API, or the JMX API. The Streams console is the easiest way to monitor Beam metrics.
In Beam, metrics are associated with steps in the pipeline execution. In Streams, the metrics are associated with the operator that corresponds to that step, and so the Beam metrics are available wherever Streams operator metrics are available.
For example, if you submit the TemperatureSample application and monitor the job in the Streams console by clicking on Job Settings and selecting Show Full Graph, the metrics are displayed when you hover over the MergeReadings operator in the Streams Graph.
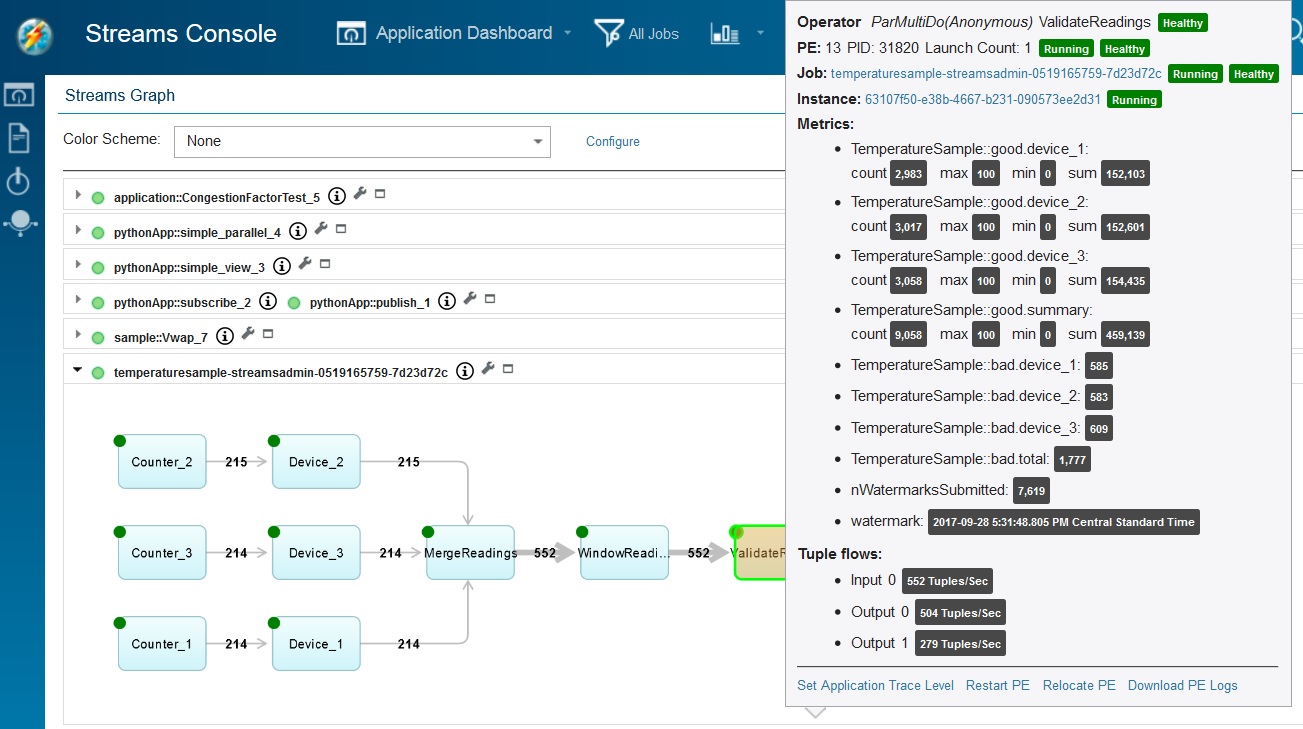
This view shows both Beam metrics and Streams metrics. Beam metrics are named differently to distinguish them.
Beam counters in namespace NS and with name NAME are shown as Streams metrics with the name NS::NAME, for example, TemperatureSample::bad.total.
Beam distributions in namespace NS and with name DIST are associated with four separate Streams metrics. These metrics are grouped under NS::DIST and include count, sum, min, and max. For example, TemperatureSample::good.device_1 shows the four metrics and their corresponding values. From these values, the mean can be derived (that is, the sum divided by the count).
These names are an implementation detail of Streams Runner and might change. If programmatic access to Beam metrics is required, the Beam queryMetrics API must be used.