Module 1 - Preparing your development system
Edit meObjectives
Before starting to develop a mediation application, your development system has to be configured, so the Telecommunications Event Data Analytics (TEDA) features are accessible.
The TEDA application framework comes with a Monitoring GUI. The Monitoring GUI is a Java program that uses the Streams REST API to retrieve information from Streams jobs, like the health status and metrics. The Java program summarizes the important information for TEDA-based applications and displays them in a GUI.
After completing this module you should be able to:
- Adapt environment settings to be able to use TEDA command line tools
- Install the TEDA plug-in in Streams Studio
- Install, run, and configure the Monitoring GUI
Prerequisites
- You installed IBM Streams version 4.2.0.
- You set the Streams shell environment by sourcing
${STREAMS_INSTALL}/bin/streamsprofile.shin your${HOME}/.bashrc. - You configured a Streams domain and a Streams instance. The domain can be a basic domain with embedded ZooKeeper with a single-host instance.
- You installed Streams Studio.
Concepts
Tasks
The following tasks are performed:
- Adapting the shell environment to be able to access TEDA command line tools and to speed up the build process.
- Installing the TEDA plug-in in Streams Studio to get access to TEDA wizards and cheat sheets.
- Installing the Monitoring GUI
- Starting and configuring the Monitoring GUI
Adapting the shell environment
The TEDA toolkit provides command line tools that are handy during the development process. To include these command line tools into your search path and to speed up the build process, insert the following lines into the ${HOME}/.bashrc of your Streams user. The lines must be inserted after the ${STREAMS_INSTALL}/bin/streamsprofile.sh.
# TEDA specific settings
export PATH=${STREAMS_INSTALL}/toolkits/com.ibm.streams.teda/bin:${PATH}
export SPLC_FLAGS=-j4
Note:
The variable SPLC_FLAGS is optional. Its value is used as command line option for the Streams compiler. The -j4 value instructs the C++ compiler to compile in parallel with four threads to speed up the build process. Don’t use a number that is higher than the number of processor cores.
Installing the TEDA plug-in in Streams Studio
The TEDA plug-in provides wizards to create SPL projects that are based on the TEDA application framework, and cheat sheets.
-
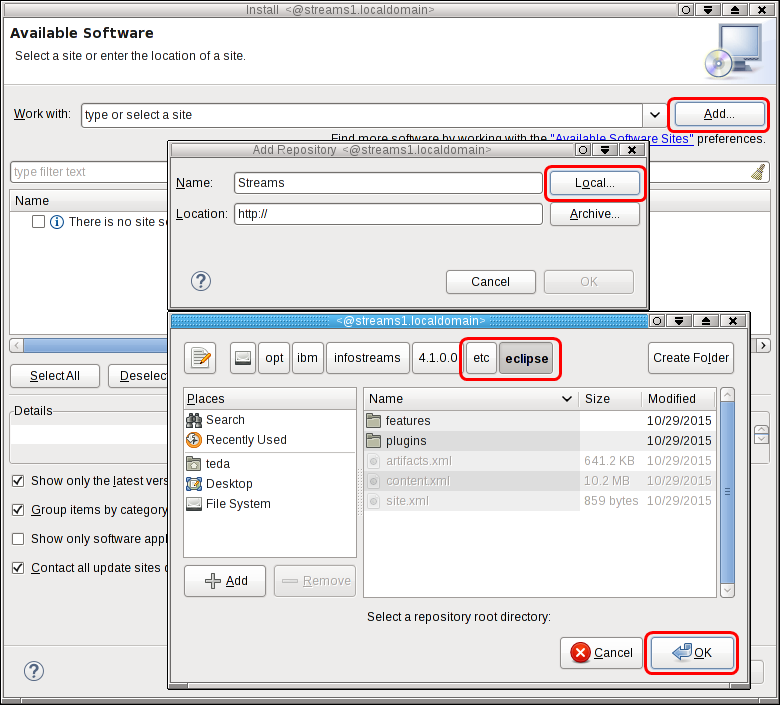
To install the TEDA plug-in, start your Streams Studio and go to Help > Install New Software and click Add… in the Available Software dialog window. The Add Repository dialog opens.
-
Enter a name for the software location and click Local…. A file dialog opens.
-
Navigate to your Streams installation directory (
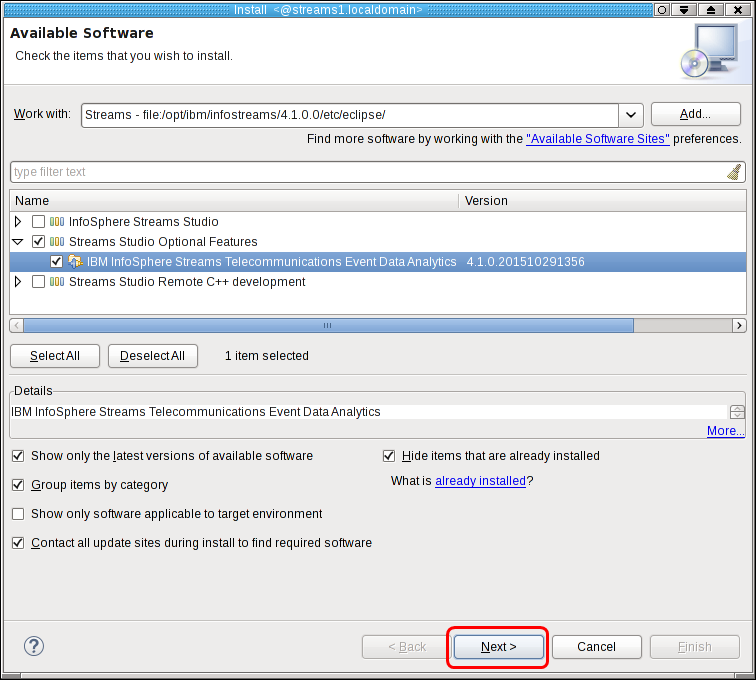
$STREAMS_INSTALL) and select$STREAMS_INSTALL/etc/eclipse. Click OK in the file dialog window and in the Add Repository dialog window. The software from the new local repository is displayed.
-
Expand the Streams Studio Optional Features tree, select IBM InfoSphere Streams Telecommunications Event Data Analytics, and click Next >.
-
On the Install Details page, click Next >.
-
On the Review license page, accept the license and click Finish.
-
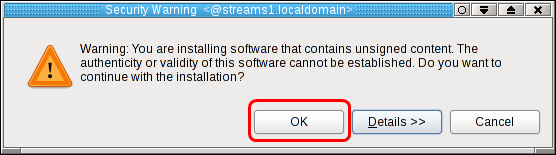
Confirm the security warning with OK.
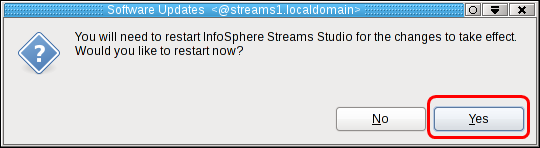
- Confirm Streams Studio restart with Yes. Streams Studio is restarting.
- Verify that you find the following new menu items in your Streams Studio:
- Help > Cheat Sheets… > InfoSphere Streams Telecommunications Event Data Analytics > Customizing the ASN1Parse operator
- File > New > Project… > InfoSphere Streams Telecommunications Event Data Analytics > ITE Application Project
- File > New > Project… > InfoSphere Streams Telecommunications Event Data Analytics > Lookup Manager Application Project
You find the procedure also in the IBM Knowledge Center under Reference > Toolkits > SPL standard and specialized toolkits > com.ibm.streams.teda > Configuring > Configuring Telecommunications Event Data Analytics for InfoSphere Streams Studio.
Installing the Monitoring GUI
The TEDA Monitoring GUI is a Java™ application that monitors the operation of TEDA applications. It displays the status of jobs and the usage of resources, such as memory that is consumed for data deduplication and lookup. It can also display the status of other Streams jobs that are not built on the basis of the TEDA framework.
The Monitoring GUI uses Streams REST APIs to retrieve the necessary data from the Streams instances. Therefore, it can be deployed on remote hosts where IBM Streams is not installed. The GUI can run on a Windows or Linux computer and requires a suitable Java Runtime Environment.
The GUI is provided as a sample application of IBM Streams. For simplicity, you should run the Monitoring GUI on your Streams host. To install the application, you need to copy the file archive that contains it only into your home directory and extract it:
cp $STREAMS_INSTALL/samples/com.ibm.streams.teda/demo/MonitoringGUI.zip $HOME
cd $HOME
unzip MonitoringGUI.zip
The directory MonitoringGUI is created in your home directory, which contains the application.
You find all information about the Monitoring GUI in the IBM Knowledge Center under Reference > Toolkits > SPL standard and specialized toolkits > com.ibm.streams.teda > Application Framework > Tools > Monitoring GUI.
Starting and configuring the Monitoring GUI
Before you initially configure the Monitoring GUI, you must start the Streams domain, so the Monitoring GUI can connect with the Streams Web Service (SWS).
To start the Monitoring GUI, change into the directory, where you installed the Monitoring GUI and run the shell script teda-monitor.sh.
cd $HOME/MonitoringGUI
./teda-monitor.sh
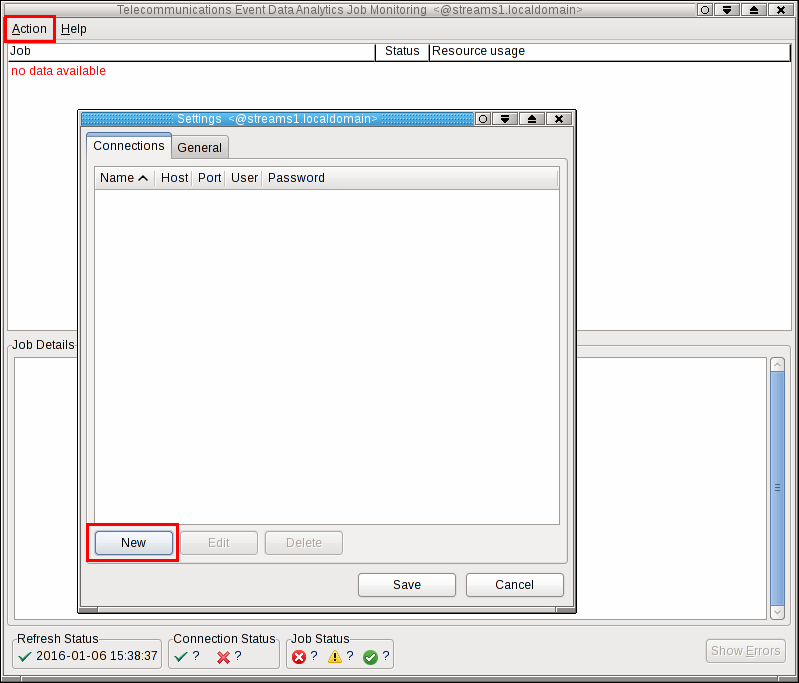
For initial configuration, select Action > Settings from the menu. In the Settings dialog, click New to create a new connection with your Streams domain.
Note: The data that you need to enter into the New Connection dialog differs from the following figure. Provide a unique connection name, for example, TEDA. Extract the host and port number from the output of command streamtool geturl. For example, if this command shows the following URL, enter streams1.localdomain as the host, and 8650 as port.
streamtool geturl
https://streams1.localdomain:8650/streams/domain/console
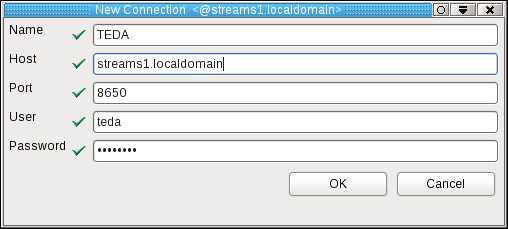
As user and password enter your user ID and password. These credentials are the same you use to login into the Streams console.
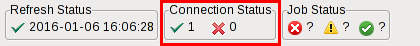
If the connection status in the Monitoring GUI shows one successful connection, you succeeded.
Next Steps
Now you are ready to create your first SPL project that is based on the TEDA framework. In the next module, you will learn how to create the SPL project for a simple mediation use case.