How to Debug Java Operators with Eclipse/Streams Studio
Edit meOne of the biggest challenges to developing a Java operator is how to debug the operator. One can use print statements or the log/trace functions to trace the operator code. This approach is cumbersome and is difficult to work with when dealing with multithreaded problems.
This post describes how to configure a Java operator so that you can use the Eclipse Java Debugger to step through your operator code. The basic idea is to start the JVM running your operator in debug mode. Once the JVM is started, you can going to use the remote support from Eclipse Java Debugger to connect to the JVM and start a debug session.
Specify which host you want the operator to run on (Optional)
If you are using the Quick Start Edition, skip this step. Otherwise, if your instance is running on multiple hosts, then you want to control where the operator is going to be run, so you can connect to the JVM process later. To place your operator to a specific host, you can use the following configuration in your Java operator invocation:
(stream<rstring name> MyJavaOp_1_out0) as MyJavaOp_1 =
                MyJavaOp(Beacon_2_out0)
            {
            config
              placement : host("hostA.ibm.com") ;
        }
}
With this placement configuration, the operator PE and its JVM will be started on “hostA.ibm.com” when the Streams application is launched.
Add Debug VM Arguments
Next, you need to add the JVM arguments that will start the JVM in debug mode and allow you to remote connect to it later. Add the following parameter to your Java operator invocation:
        (stream<rstring name> MyJavaOp_1_out0) as MyJavaOp_1 =
            MyJavaOp(Beacon_2_out0)
        {
           param
                vmArg :
                    "-agentlib:jdwp=transport=dt_socket,suspend=n,server=y,address=hostA.ibm.com:7777" ;
            config
                placement : host("hostA.ibm.com") ;
        }
This vm argument does the following:
agentlib:jdwp=transpoort_dt_socket– starts up the JVM in debug mode, opens up a socket to listen for incoming debug connectionsuspend=n– when the JVM is being started, start running without waiting for a remote debug connection to be established. Tip: Change this tosuspend=yif you want the JVM to wait for a connection before it starts running.address=hostA.ibm.com:7777– the host that the JVM will be running on, and the port to open to wait for an incoming debug connection
Start the Eclipse Java Debugger
Next, you can launch the Streams application as you normally would. Once the application is started, you can connect to the operator JVM.
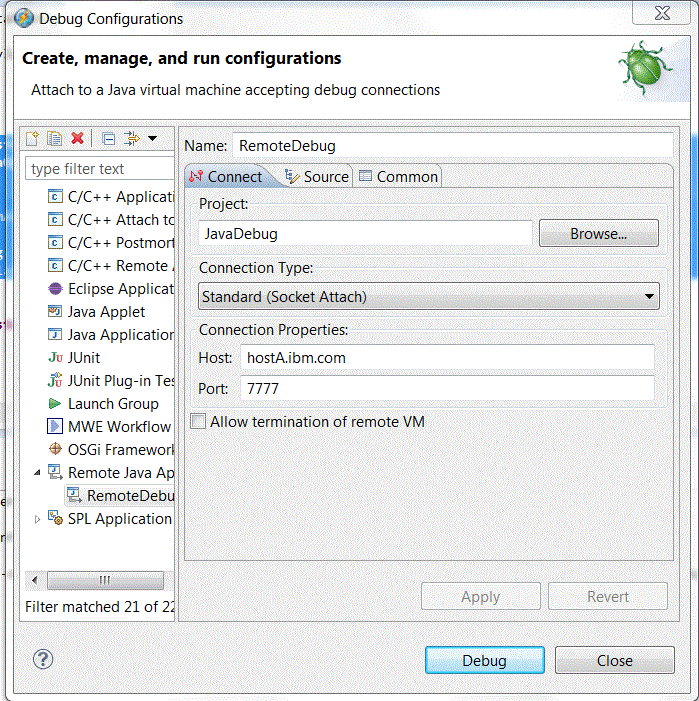
- Create a new Remote Java Application debug launch configuration. You can do this by pulling down the “Debug” drop down menu from the top menu in Streams Studio. In the drop down menu, select “Debug Configurations…” In the Debug Configurations dialog, create a new Remote Java Application launch configuration.

- In the Remote Java Application, specify the following:
- Project – Specify the project where your Java operator source code resides
- Host – the host on which the operator is running on
- Port – the port that the debug engine is listening for incoming debug connection

- Click Debug to connect the Eclipse Java debugger with the operator JVM.
Setting Breakpoints
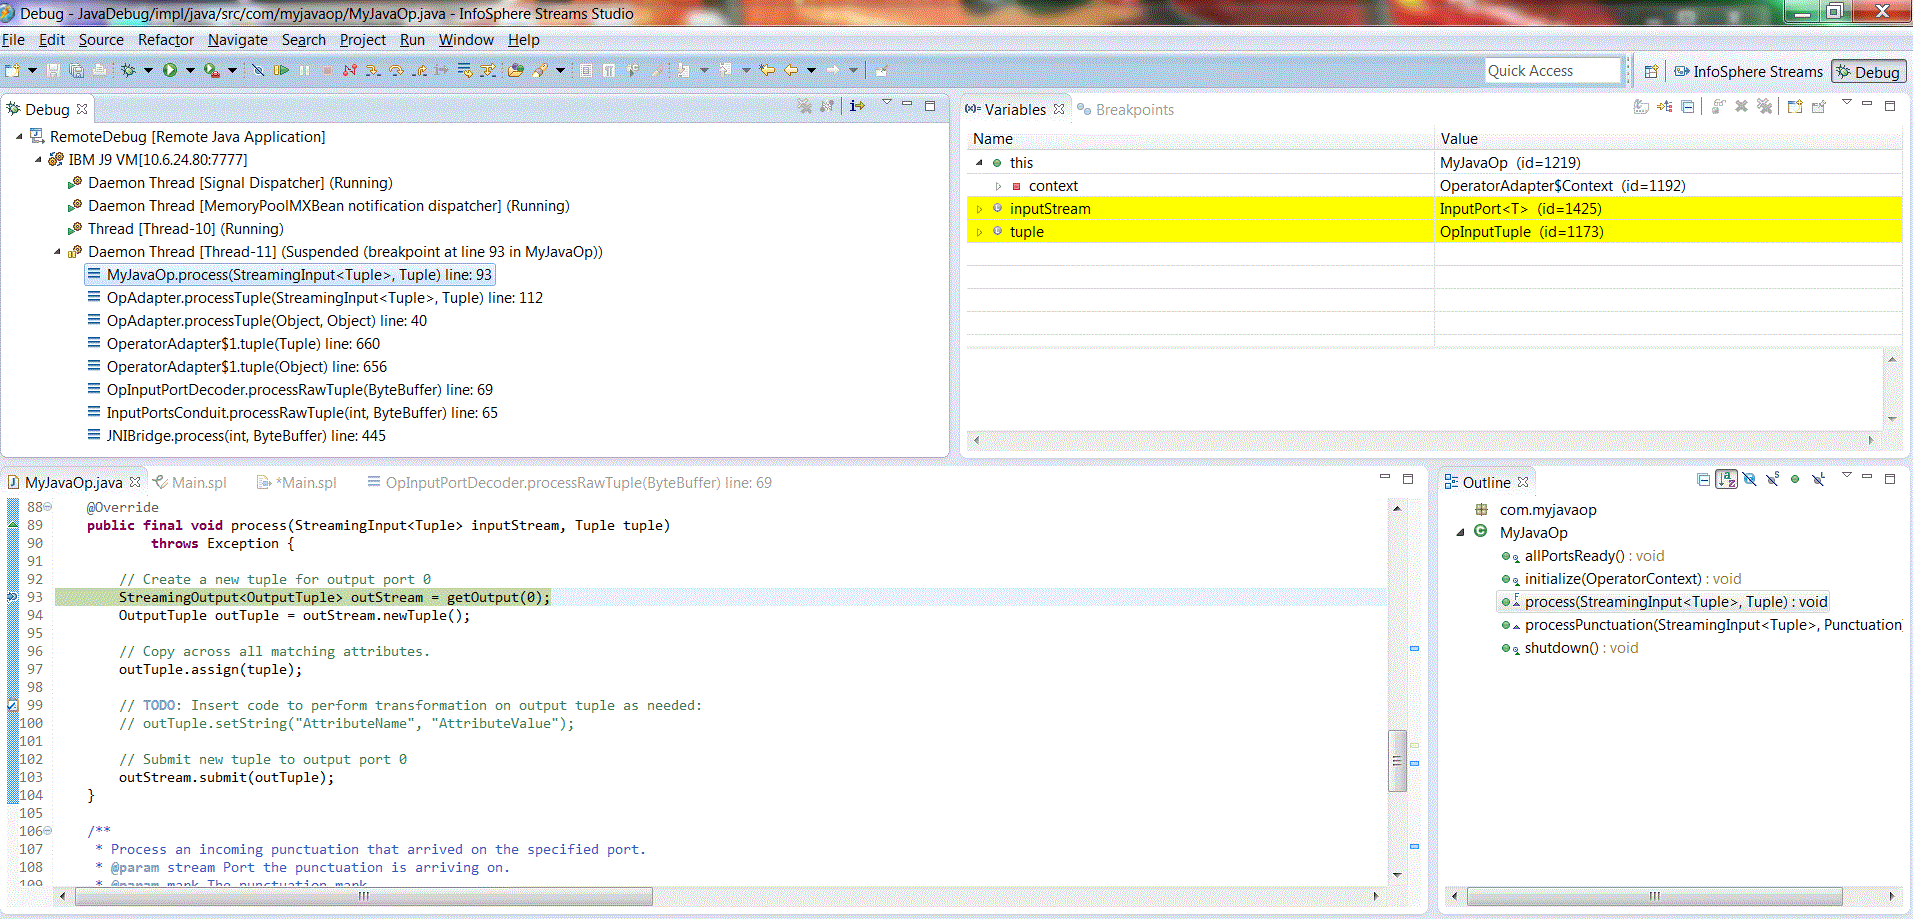
If the debug connection can be successfully established with the operator JVM, a new debug session will be shown in the Debug view in Eclipse. To stop the debugger, you can set a breakpoint in the source code in the Java Editor by double clicking on the ruler of the editor. I usually set a breakpoint inside the process tuple method to see how my tuple is going to be processed.

When the breakpoint is hit, the debug session will suspend the JVM at the desired location. You can then step through the operator code, and inspect variables.
Debug Perspective
Once the debugger is started, switch to the Debug Perspective. You should see something like the following. The debug view will show all the threads that are currently running. The suspended thread will show the call stack. You can inspect variables by looking at the Variables view and see how they are changed as you step through the code.
